Michael Vi
Michael Vi
Charter Communications (NASDAQ:CHTR) flipped on my radar when I was looking at some recent buys from super investors and noticed Charter ranked pretty high on the list last quarter. Several funds and investors have 10-20% positions in Charter or a combination Liberty Broadband Corporation (LBRDK), which owns 26% of Charter. Furthermore, Chris Winfrey, Charter's CEO purchased over around $1.5 million worth of shares on 2/07/2024. Charter currently stands at a significant discount to when super investors bought and around the same price as Winfrey's purchase price.
I switched my mobile provider from Verizon to Charter last year to complete my Spectrum One bundle and have been pleased with the quality and price so far. These two things motivated me to take a deeper look into the stock and it's quite clear why everyone is buying it up right now.
Charter is highly profitable on its tangible assets and trading at a significant discount. Its leverage strategy is misunderstood by the market which is why I believe now is a good time to scoop up some shares.
Spectrum's moat comes from the utility-like business model of cable broadband and the tangible fixed assets it invests in. To improve efficiency, take advantage of scale, maintain a high entry to barrier, and grow organically, Charter must use debt fixed at a low interest rate.
A bearish thesis I have seen presented by others is the heavy net debt loading of Charter's balance sheet relative to their EBIDTA, or earnings. Bears believe this is a risk, especially during a high interest rate environment with recent earnings showing a slowdown in earnings growth to pay off said debt. Furthermore, bears would say management has been unresponsible by repurchasing shares instead of paying off this debt over the years. I can see why others can presume this is negative if Charter's business model was more typical, however this is not the case. At its core, Charter is a levered equity play. This means their net debt loading is cheap to finance and they use it to buy back equity in the form of share repurchases, M&A or special projects that yield returns greater than the interest on the debt.
It's similar concept to those sitting on homes bought with juicy fixed 2-5% interest rate loans. Though some may get a warm fuzzy feeling paying off this debt early, mathematically it doesn't really make sense since you're more likely to make better returns through equities in the public market. Furthermore, you leave yourself more liquidity and optionality to refinance in the future. Of course there are risks to this, and it requires special dedication and self control to not waste the additional funds available or else things could turn sour quick in a recession. Thus, part of the investment thesis in Charter is belief in their management's competence and investment decisions.
Figure 1: CHTR Leverage Ratio (Author Using Seeking Alpha Data)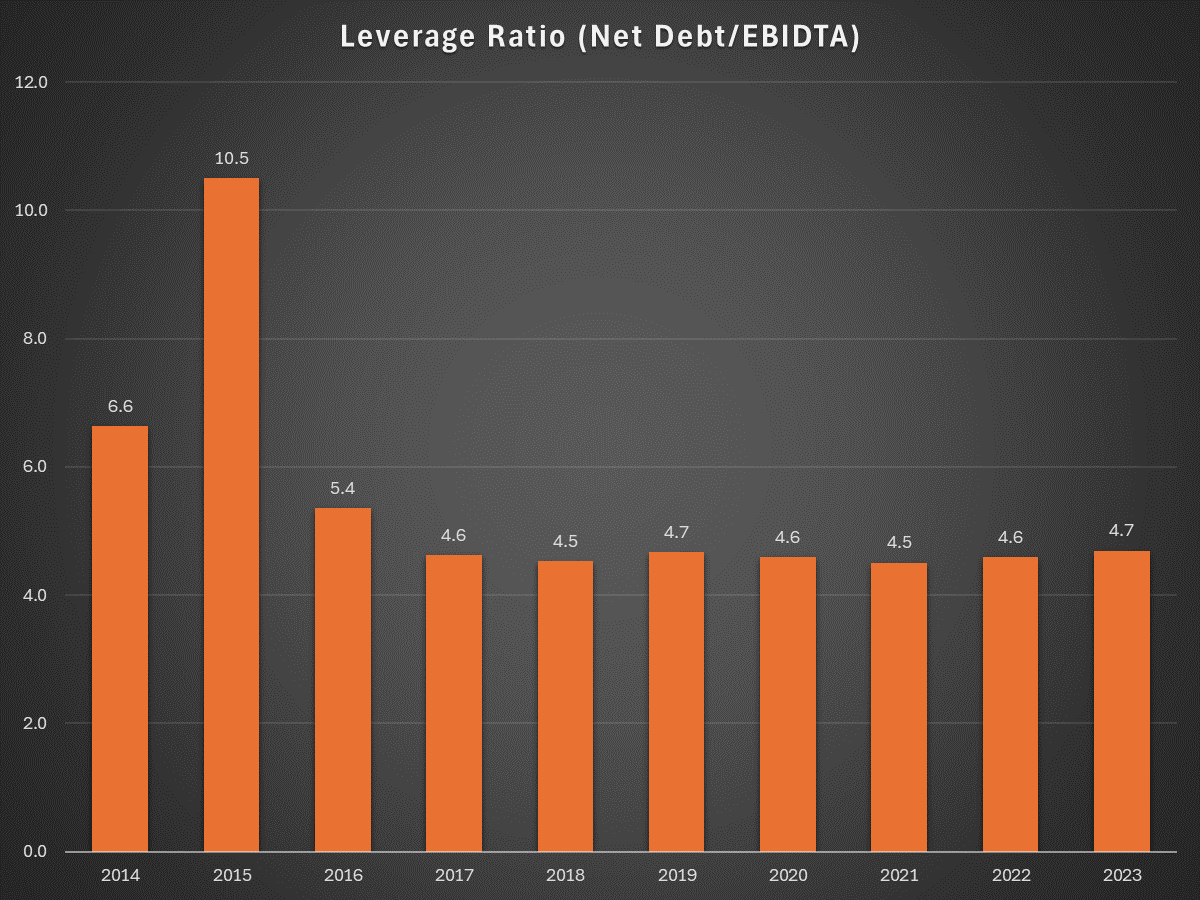
Charter's leverage on a net debt to EBIDTA basis has consistently been in the 4.5-4.7x range since 2017. This is of course post merger of Time Warner in 2015. This magic ratio is by design as it allows Charter to maximize the infrastructure investment while still generating enough EBIDTA to pay off the interest on the debt. This infrastructure is what generates a moat for Charter and eventually shareholder returns. This debt comes currently comes with Weighted Average Cost of Debt of 5.3%, a weighted Average Live of 12.8 Years, a fixed rate of 86% with 90% of the debt maturing beyond 2026.
Figure 2: Charter Debt Maturity Profile (Charter Fourth Quarter and Full Year 2023 Results Presentation)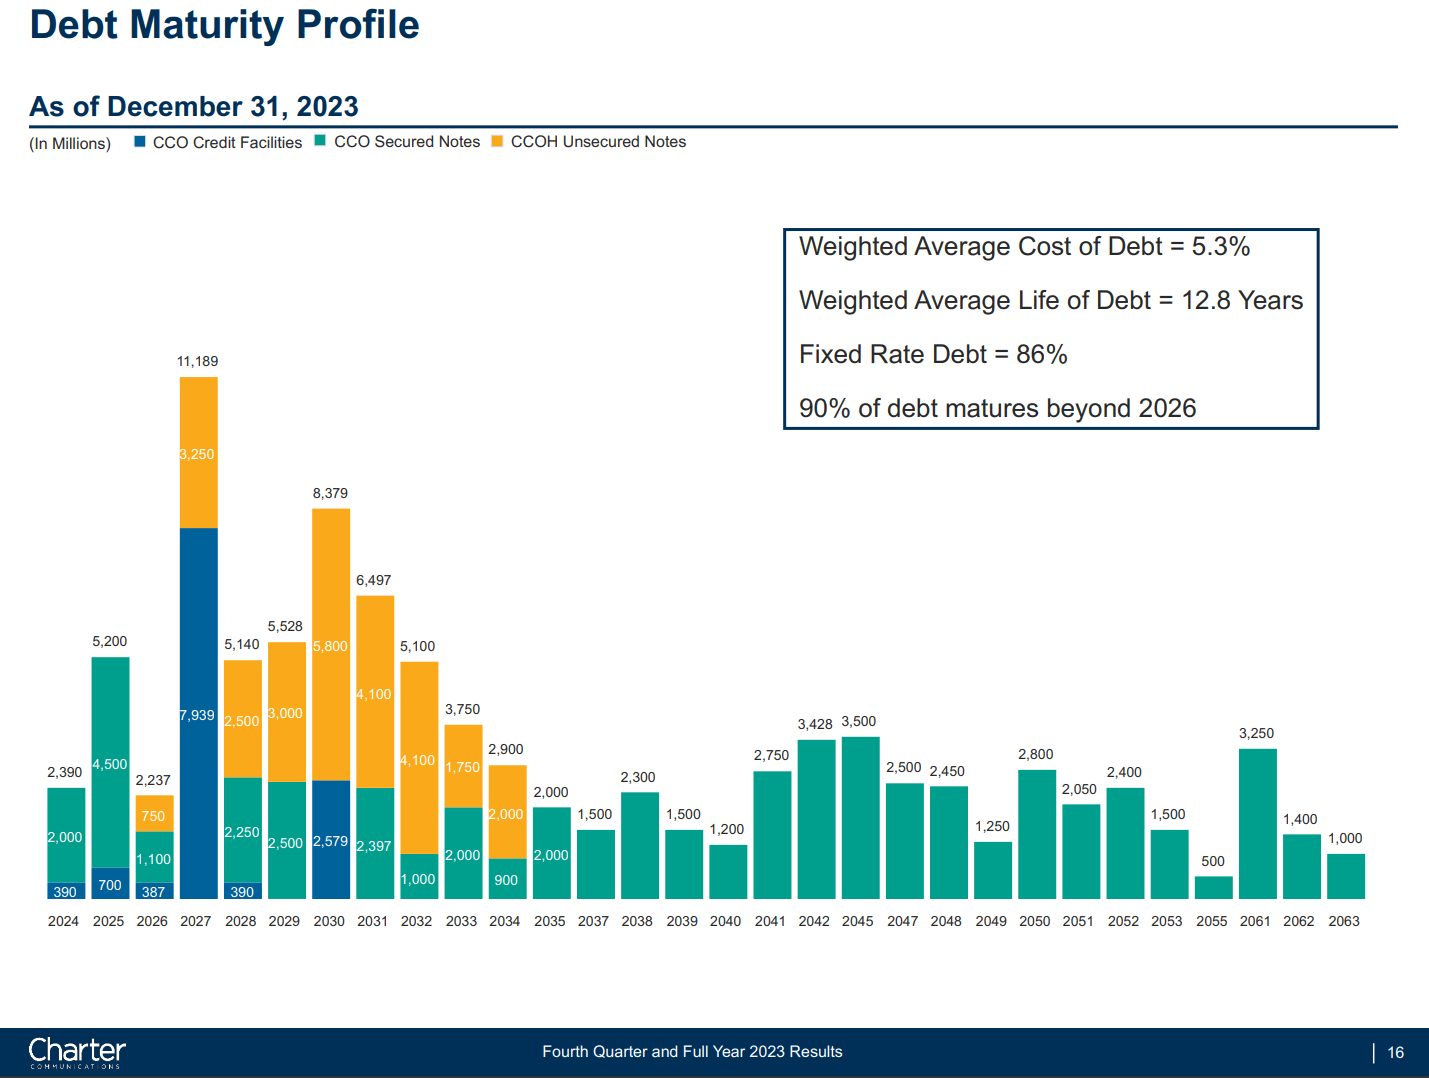
In other words, the majority of the debt is fixed at a low interest rate, spaced out in manageable-sized pieces over several years. Refer to my homeowner example here. The good news is they don't really have much due until 2026, however the distribution is heavy loaded immediately following that. One would think as macroeconomic conditions improve over the next decade, Charter will have the availability to refinance some of these debts at a lower rate. Fitch has Charter rated BB+ indicating a stable outlook although it should still be kept in check.
Debt used to fund capital investments is only useful as the returns and maintenance costs tied to it. For Charter's case, these capital expenditures can be in the form of the following:
The takeaway here is Charter as a lot of assets to take care of and a lot of CapEx responsibilities. And with the majority of these being funded through low interest bearing debt, it's very important they are getting good returns out of said assets from a risk reward aspect.
Figure 3: Return on Net Tangible Assets (Author using Seeking Alpha Data)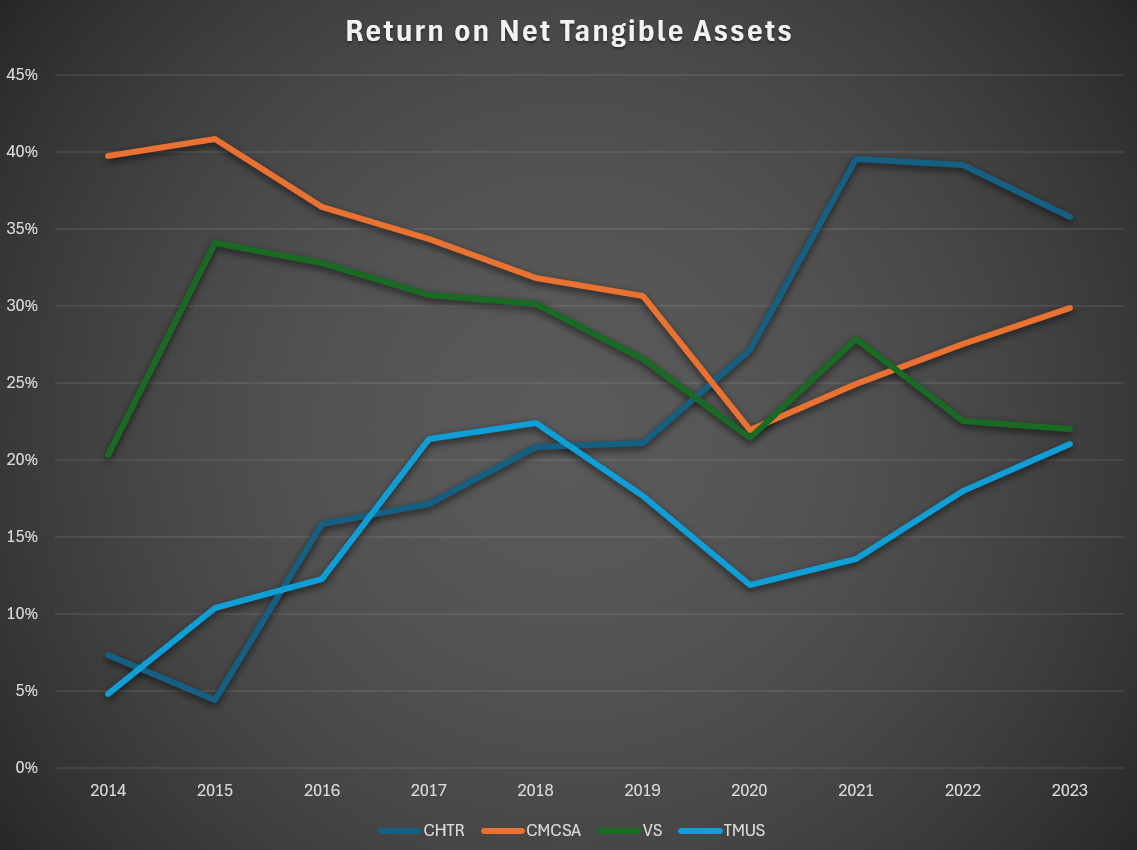
One way to visualize this is by looking at their Return of Net Tangible assets or ROTA/RONTA. This is a figure often quoted by Warren Buffet in his interviews regarding his Kraft Heinz investment. I calculate it by subtracting total assets from goodwill, other intangibles, and total current liabilities which gives me net total assets ("NTA"). I then divide earnings before interest and taxes ("EBIT") or operating income by NTA to give me the RONTA value. If I plot this overtime versus other communication companies, I come up with a graph showed in Figure 3. What this graph shows me is Charter has climbed itself the top yielding 35-40% RONTA. This means for every $100 of tangible real assets Charter has on its balance sheet, they produce $35-40 of operating profit. Less low interest debt and lower taxes, you're left with assets that make a decent amount of money, especially compared to the industry.
Profitability of Cable and Satellite Sector (Seeking Alpha)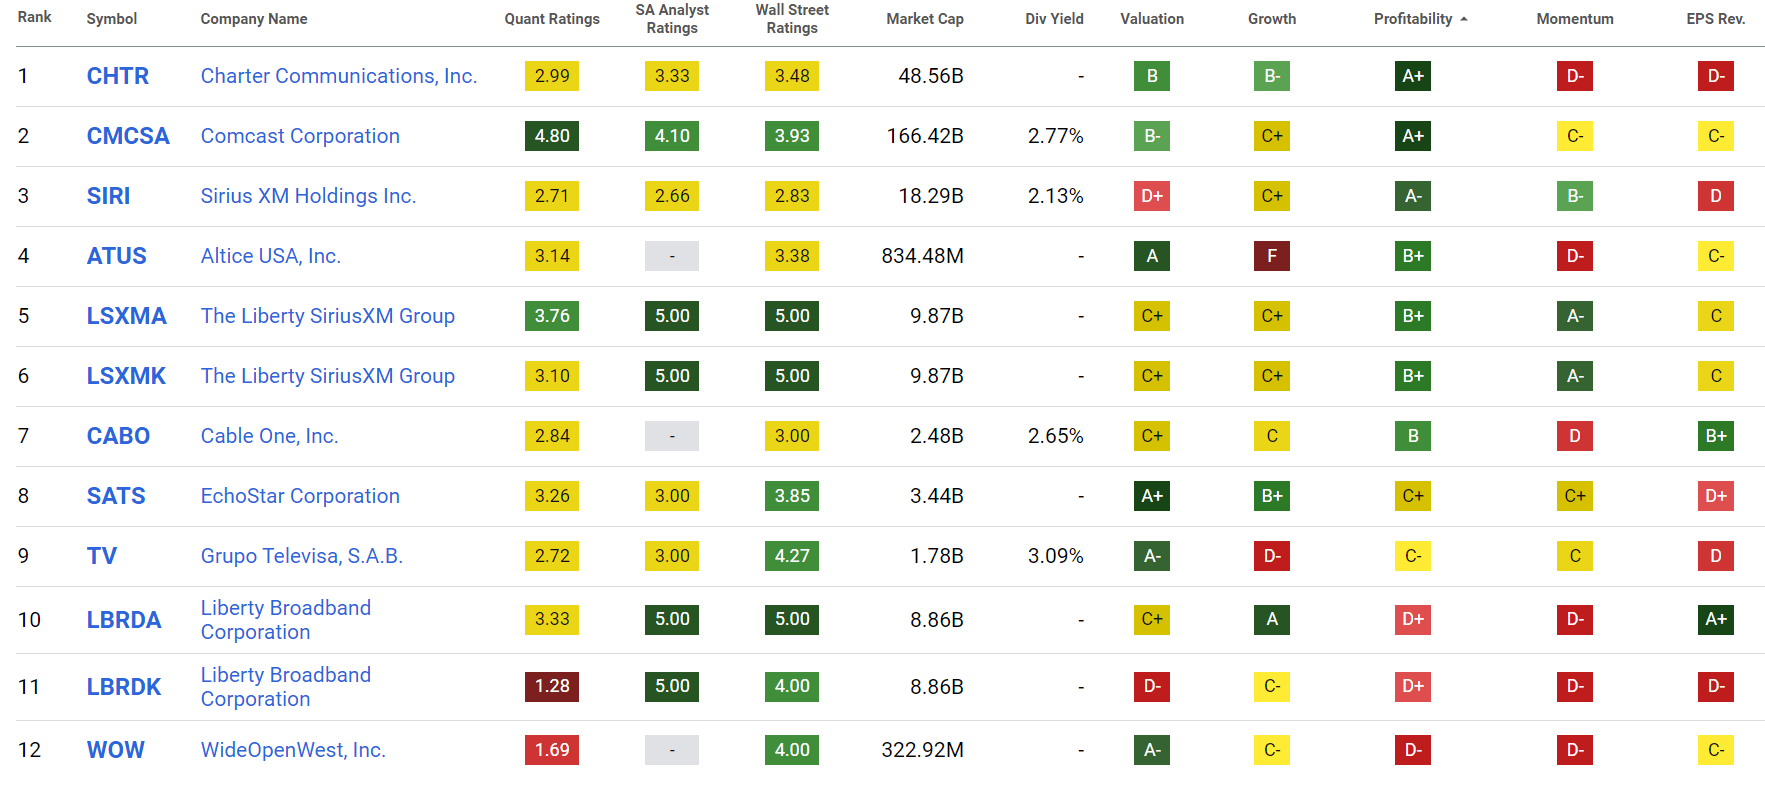
Seeking Alpha has provided great information to supplement this. Charter ranks 1 out of 12 in the top Cable and Satellite sector stocks when the profitability rating is filtered from highest to lowest.
Profitability of Communication Industry (Seeking Alpha)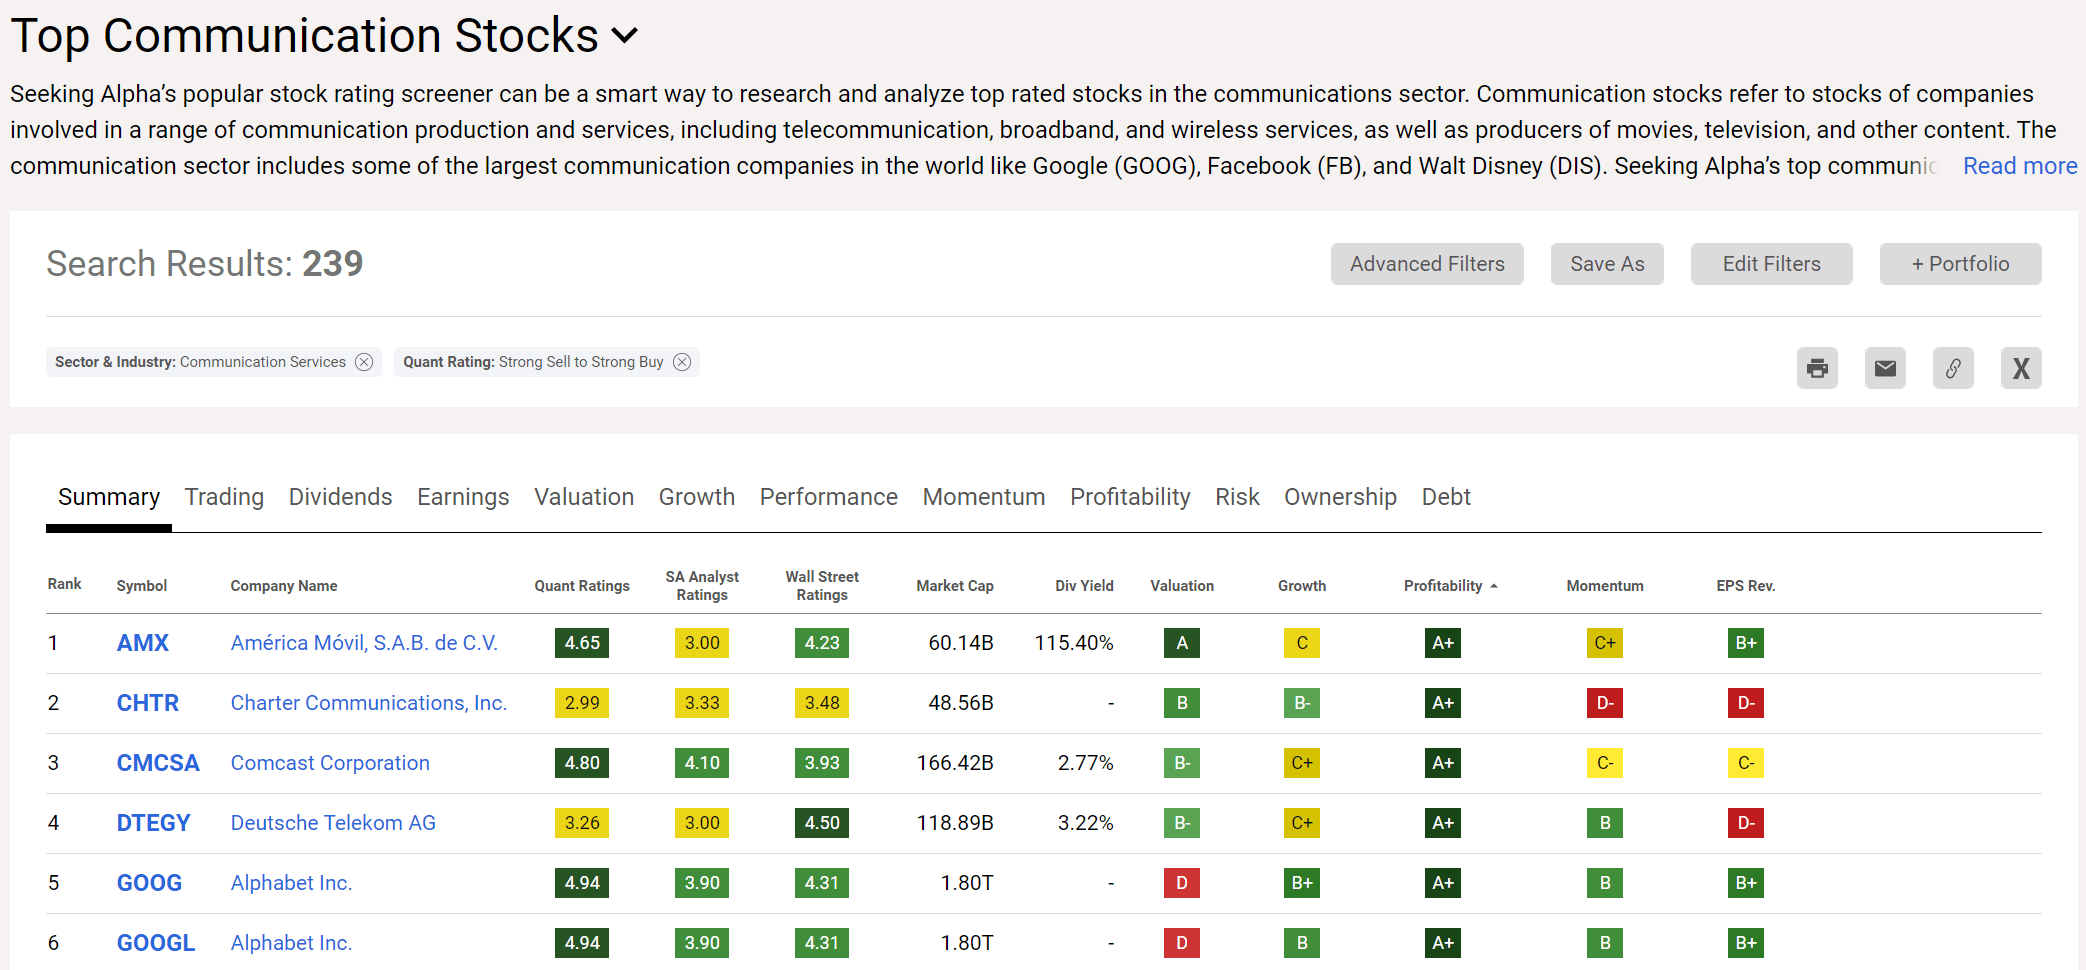
By the same measure, Charter ranks 2 out of 239 in the top stock in the communication industry. It's no wonder Charter feels so safe at 4.5-4.7x leverage. Their tangible assets and overall investment choices are very profitable, which allow more cushion to pay interest payments.
Valuation was done through an unlevered discounted cash flow ("DCF"). Here we use the weighted average cost of capital ("WACC") as a discount rate. This is very important because WACC includes the entire capital structure, including debt, to determine a hurdle rate for the company on a risk adjusted basis compared to the total market. If one were to value Charter simply by the equity, they will most likely come up with low target valuations. As mentioned above, the investment thesis on Charter depends on the value the debt structure provides to shareholders. Furthermore, risk adjusted returns are very important for investors portfolio volatility as we want to know if we are just better off investing in S&P 500 versus Charter.
Charter WACC Calculation (Author using Various Datasets)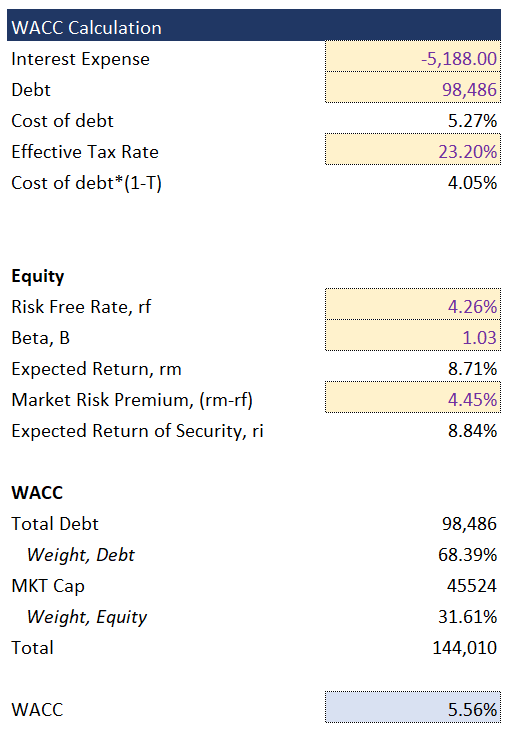
Thus, let's start with the WACC calculation. Interest Expense, Net Debt, and Effective Tax Rate values come from Seeking Alpha. Risk Free Rate, and Beta come from a culmination of public sources. The Market Risk Premium is from Damodaran Online. We arrive at a value of around 5.5%. This makes sense since the majority of the capital structure is funded through debt at a cost the cost of interest. As previously mentioned, Charter expects their weighted average cost of debt to be in the 5.3% range. This is a bit higher than our current rate, so we will bump up our WACC discount rate to about 6.5% in our DCF for a safety factor.
DCF Income Statement Inputs (Author)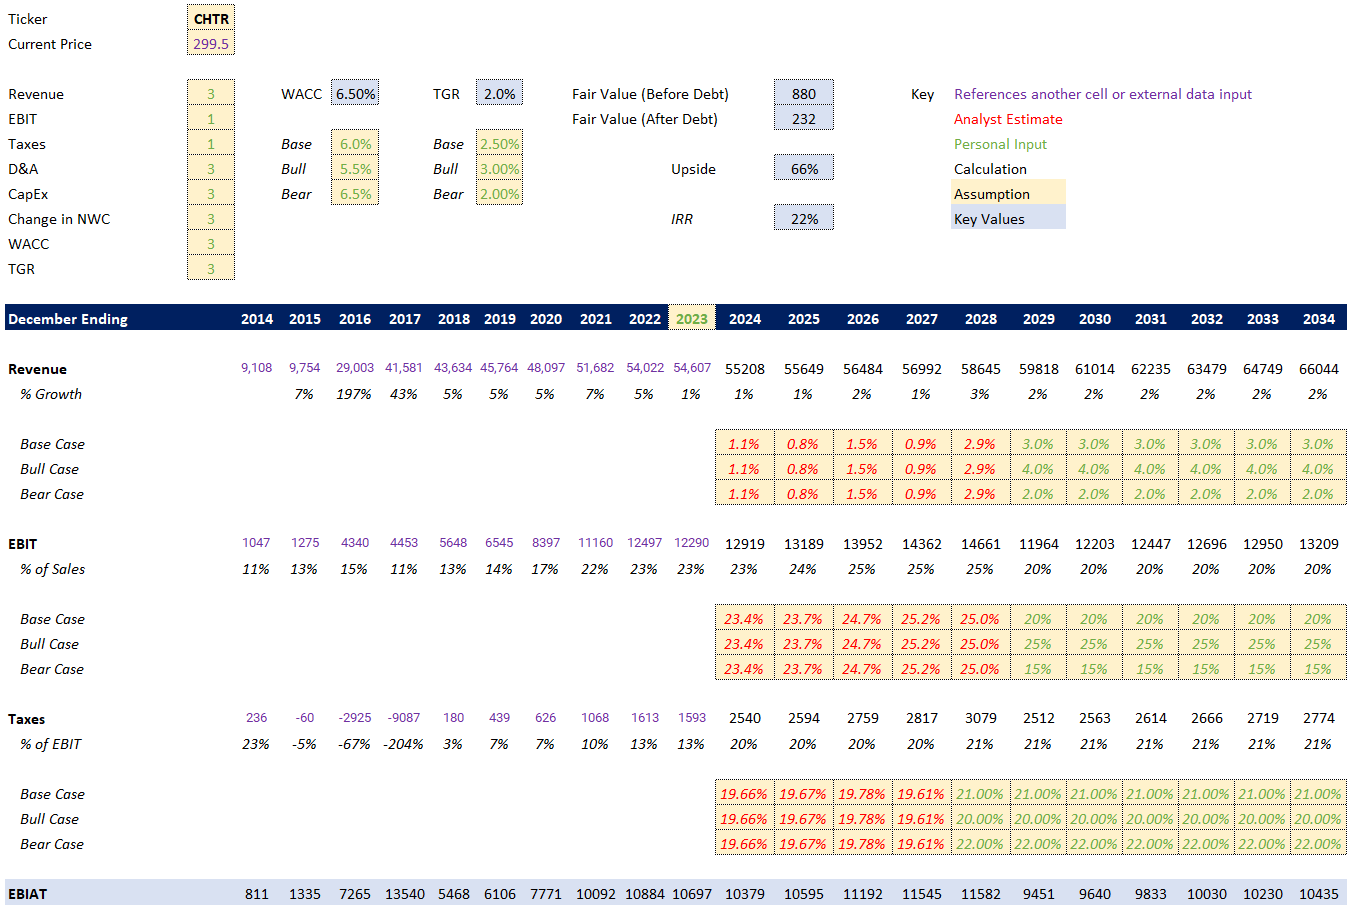
For the income statement inputs, Revenue, EBIT historical values were gathered from Seeking Alpha. For the first 4-5 years of the forecast, I simply input averages of analyst estimates. Then the remaining 5-6 years, I input some personal conservative projections.
DCF Cash Flow Inputs (Author)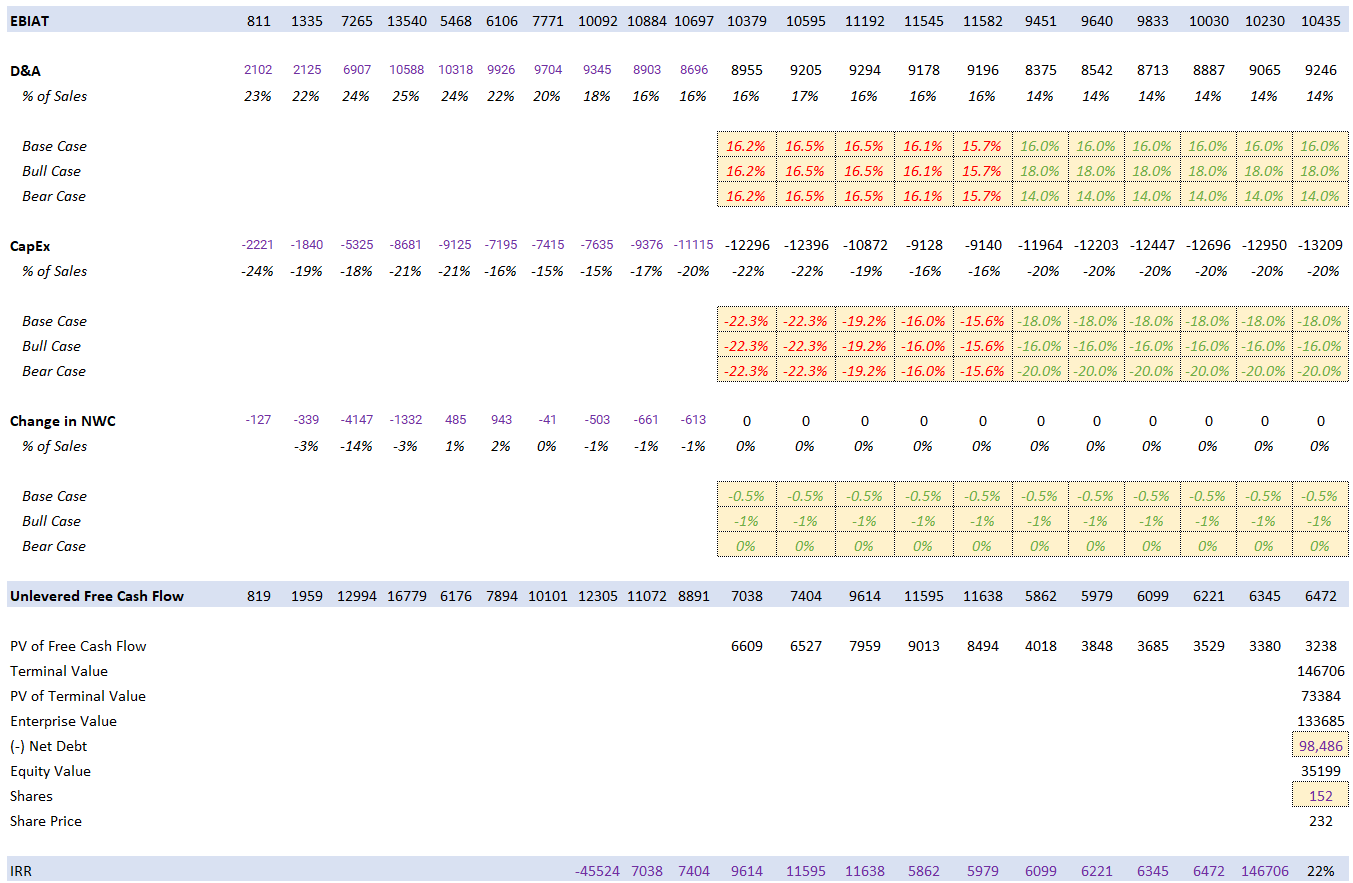
The same methodology was used for cashflow inputs of Depreciation and Amortization ("D&A"), CapEx, and Change in Net Working Capital ("NWC"). Again, since WACC is used as a discount factor, the Fair Value before debt is applied will be our implied share price. When all switches are changed to bullish figure, we arrive at risk adjusted share price of $3233 for a 36% internal rate of return ("IRR") of 36%. A Bearish prediction of $617 a share for an 18% IRR, and a Base/Street case of $1506 for a 28% IRR. For my personal projection, I used all bearish figures except for EBIT as I believe Charter can sustain above 20% EBIT margins given their excellent profitability scores. This results in a fair value of $866 a share for a 22% IRR. As a bit of a smell check, CHTR stock hit just above $800 a share in August of 2021. This indicates, at least by my standards, Charter has been trading at undervalued prices for quite some time which means the share buybacks were accretive.
Risks tied to this investment is if competition in fiber or fixed wireless access ("FWA") take out Charter's margins and then they struggle to pay of their interest. Another risk assumes the macroenvironment leads itself to continued high interest rates which won't allow Charter to refinance or prolong debt payments at a lower rate. Both of these things could spell disaster for Charter which may explain the significant discount.
However, I believe the competition is a bit of a weak argument because fiber is extremely expensive to invest in and consumers don't really want it from a cost/quality perspective. This means the improved upload and download speeds with fiber are virtually unnoticed by the consumers for most applications, yet it comes at a hefty price. On the opposite side of the argument, FWA doesn't deliver the quality needs at scale for many applications and is limited by the physical signal through different media rather than a electrons through a cable. Charter acts much like the pipework of a utility to a home and will the business model makes sense to me. Charter is looking to offer "good enough" speeds at the lowest price and will leverage their assets to achieve that. It worked for me as cost was the sole reason I switched to them a couple years ago.