
bymuratdeniz
bymuratdeniz
Following a strong finish to 2023, where the ProShares S&P 500 Dividend Aristocrats ETF (NOBL) posted a respectable 8.12% return, the Fund lost its momentum in early 2024. NOBL started out the year by falling 0.47% in January. Historically, NOBL has never performed well in the first month of the year, on average seeing a -0.53% loss during the past 11 January's. Out of all 12 calendar months January has the second worst average return.
February, on the other hand, is fairing much better thus far. Through February 23rd, NOBL is up 2.23%, pushing its year-to-date return into positive territory.
Not all dividend aristocrats followed the same negative trajectory as NOBL to start out 2024. Let's take a look at which individual aristocrats drove the ETFs return last month; 36 dividend aristocrats outperformed NOBL during January. The following 31 aristocrats all posted positive returns to start out the year:
The S&P 500, as measured by SPDR S&P 500 Trust ETF (SPY), was up 1.59% in January, outperforming NOBL during the month. Month-to-date through February 23rd SPY is up 5.17%, far ahead of NOBL which is up 2.23%. The dividend aristocrats are not known to consistently beat the S&P 500 index, in fact, the dividend aristocrat index underperformed the S&P 500 index for 7 out of the last 9 full calendar years.
However, if you look further back in history, the dividend aristocrat index is outperforming the S&P 500 index by about 2.18% per year between 1990 and 2022. A significant portion of this long-term outperformance is attributable to the dot com bubble and the financial crisis as well as the immediate years following each market crash. This pattern was broken with the 2020 market crash, perhaps the much shorter duration of the crash and recovery are the reason. The dot com bubble and the financial crisis both extended for multiple years while the 2020 market crash was fully recovered in a matter of months. 2022 also proved to be a strong year for the aristocrats as they earned 15.15% of alpha on the S&P, making up for 3 years of underperformance.
Even though the dividend aristocrats have trailed the S&P for the better part of the last 9 years, long-term investors can rest assured that based on history, over a much longer time period, the dividend aristocrats can hold their own. There are currently 67 companies in the dividend aristocrat index but strong historical returns for the index can be attributed to only a handful of them. As an investor, I am always curious how to identify these drivers of outperformance.
Several changes were made to the dividend aristocrat list during the course of 2023 and in early 2024. Last year we saw V.F. Corporation (VFC) and Walgreens (WBA) fall off the list. Kenvue (KVUE) joined after it was spun off from Johnson and Johnson. And in early 2024 we welcomed a new dividend aristocrat, Fastenal (FAST).
I want to present 3 strategies that theoretically could identify winning aristocrats and lead to better performance than the dividend aristocrat index. These strategies work best with a buy-and-hold long-term investing approach as will be evidenced by the results. They are based on quantitative models that do not consider qualitative data; therefore it is prudent that further due diligence is performed on all chosen stocks.
Strategy number 1 is a focus on valuation and more specifically it targets the potentially most undervalued dividend aristocrats. In theory, this is a long-term strategy since it may take some time to fully see the reward of leveraging a valuation approach. My preferred method for valuation is dividend yield theory, mainly for its simplicity. Unlike other valuation methods, dividend yield theory does not require making assumptions aside from assuming that a given stock will revert back to its long-term trailing dividend yield.
This valuation technique works best for mature businesses with long histories of dividend growth, making the dividend aristocrats an ideal pool of companies to value using this technique.
Selecting the 10 most undervalued dividend aristocrats each month and adopting a buy-and-hold investing approach can lead to long-term outperformance when/if the targeted stocks return to fair valuation. It may take a few months or even years to see if this strategy actually pays off. I predict that it will underperform NOBL for the first few months while we wait for bargain stocks to return to fair value.
Month | Most Undervalued | NOBL | SPY |
Aug 21 | 0.49% | 1.87% | 2.98% |
Sep 21 | -2.99% | -5.69% | -4.66% |
Oct 21 | 3.63% | 5.95% | 7.02% |
Nov 21 | -2.19% | -1.76% | -0.80% |
Dec 21 | 10.37% | 6.54% | 4.63% |
Jan 22 | 1.04% | -4.08% | -5.27% |
Feb 22 | -1.94% | -2.59% | -2.95% |
Mar 22 | 3.40% | 3.86% | 3.76% |
Apr 22 | -2.14% | -3.42% | -8.78% |
May 22 | 3.11% | 0.31% | 0.23% |
Jun 22 | -7.30% | -6.73% | -8.25% |
Jul 22 | 5.00% | 6.56% | 4.55% |
Aug 22 | -3.25% | -2.78% | -4.08% |
Sep 22 | -11.39% | -9.15% | -9.24% |
Oct 22 | 10.07% | 10.31% | 8.13% |
Nov 22 | 6.99% | 7.12% | 5.56% |
Dec 22 | -5.41% | -4.12% | -5.76% |
Jan 23 | 4.83% | 3.23% | 6.29% |
Feb 23 | -3.33% | -2.36% | -2.51% |
Mar 23 | -0.86% | 0.99% | 3.71% |
Apr 23 | 3.06% | 2.12% | 1.60% |
May 23 | -7.87% | -5.90% | 0.46% |
Jun 23 | 7.17% | 8.08% | 6.48% |
Jul 23 | 3.27% | 2.59% | 3.27% |
Aug 23 | -3.82% | -2.34% | -1.63% |
Sep 23 | -7.37% | -5.72% | -4.74% |
Oct 23 | -5.21% | -3.49% | -2.17% |
Nov 23 | 8.35% | 6.60% | 9.13% |
Dec 23 | 7.93% | 5.24% | 4.57% |
Jan 24 | -2.98% | -0.47% | 1.59% |
Feb 24 | 1.23% | 2.23% | 5.17% |
2021 Partial | 9.05% | 6.54% | 9.06% |
2022 | -3.91% | -6.50% | -21.65% |
2023 | 4.25% | 8.12% | 26.18% |
2024 | -1.79% | 1.75% | 6.84% |
TOTAL | 7.28% | 9.59% | 15.20% |
Alpha over NOBL | -2.31% | ||
Alpha over SPY | -7.91% |
The table above shows the monthly and annual returns for the buy-and-hold portfolio of the most undervalued strategy.
The portfolio lost to NOBL in January by 2.51% and SPY by 4.57%. February thus far is not looking too good either, the portfolio is up 1.23% (price only return) through February 23rd, while NOBL is up 2.23% and SPY is up 5.17%. Since inception, the portfolio trails both NOBL and SPY, by 2.31% and 7.91%, respectively.
At its peak, this strategy was ahead of both NOBL and SPY by double-digit gains. While such outperformance is not something I am expecting out of this strategy, it has shown merit when stock valuations revert to historical means. It's expected that a strategy based heavily on valuation will cycle in and out of favor.
The portfolio consists of 39 unique present and former dividend aristocrats. I track this portfolio by investing $1,000 each month equally split among the 10 chosen aristocrats for that month. A change to this buy-and-hold strategy was implemented at the start of February. All former dividend aristocrats that were included in the portfolio were sold with the proceeds reinvested amongst the 10 chosen aristocrats for the month of February. Going forward, all aristocrats that lose their status will be removed from the portfolio promptly.
Here are the 10 most undervalued dividend aristocrats chosen for the month of March 2024. The table below shows potential undervaluation (column Over/Under) for each of the 10 chosen aristocrats. The image below is taken from a new spreadsheet I recently created where I am self-computing the 5-year trailing dividend yield. Previously I used Seeking Alpha as a source for the historical yield.
Created by Author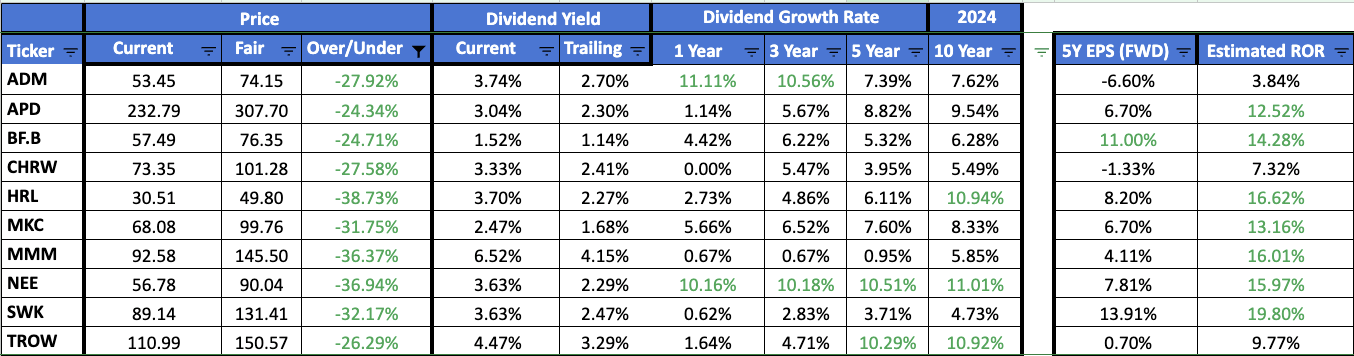
The top 10 list has two changes compared to the prior month. Medtronic and Target (TGT) drop off and are replaced by Air Products and Chemicals (APD) and C.H. Robinson Worldwide (CHRW).
APD stock fell sharply at the start of February, it has since recovered some of the initial losses but still remains below its ending January share price.
Here is a closer look at the dividend yield theory valuation for Air Products and Chemicals which looks approximately 24% undervalued.
In the image below the black line is the actual price since January of 2017. The light green shaded area represents a 0 to 15% undervalued zone. The dark green area represents an undervaluation in excess of 15%. The light red shaded area represents a 0 to 15% overvalued zone.
Created by Author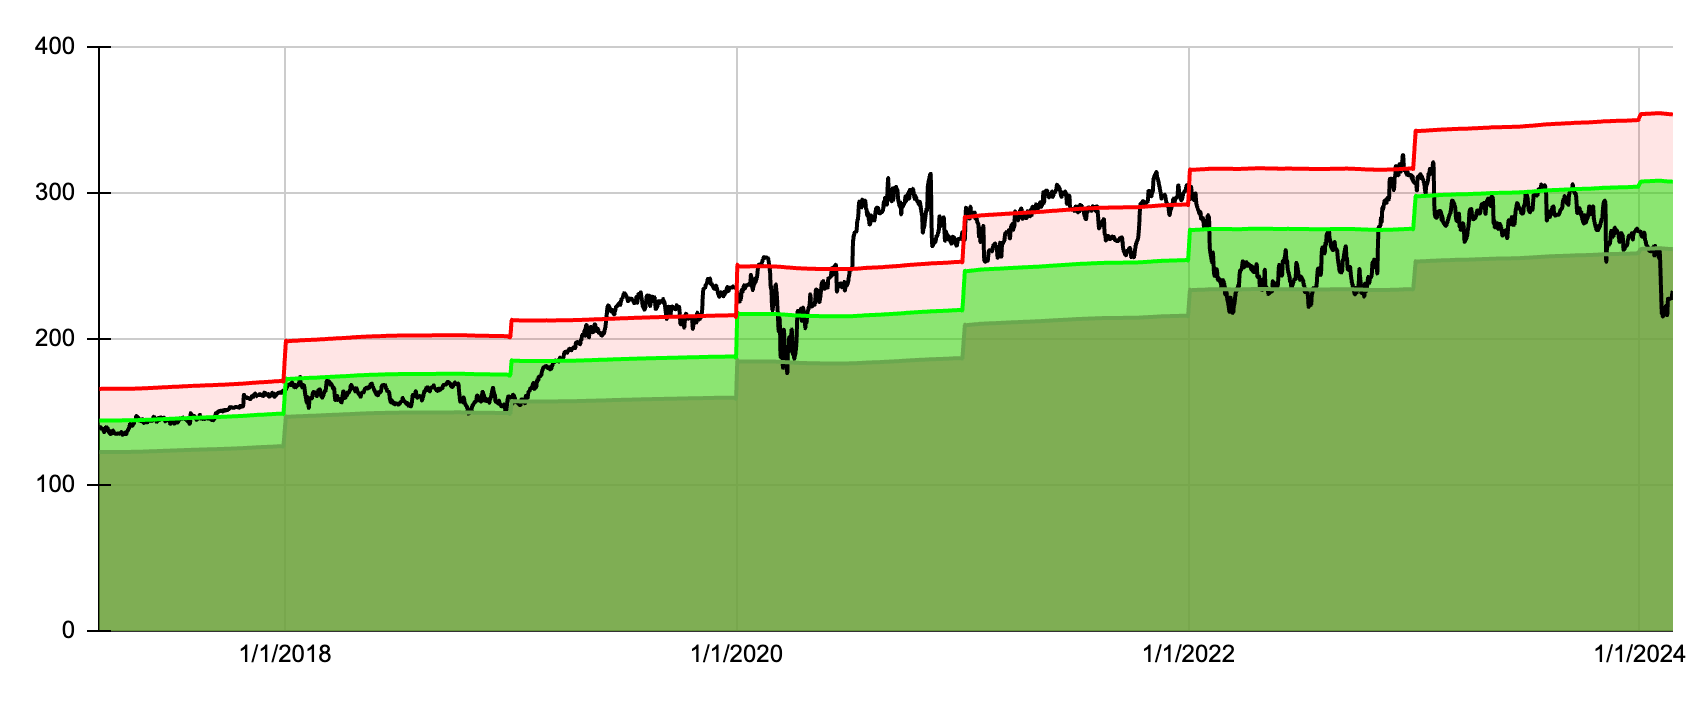
Here is a closer look at the dividend yield theory valuation for C.H. Robinson Worldwide which looks approximately 27% undervalued.
Created by Author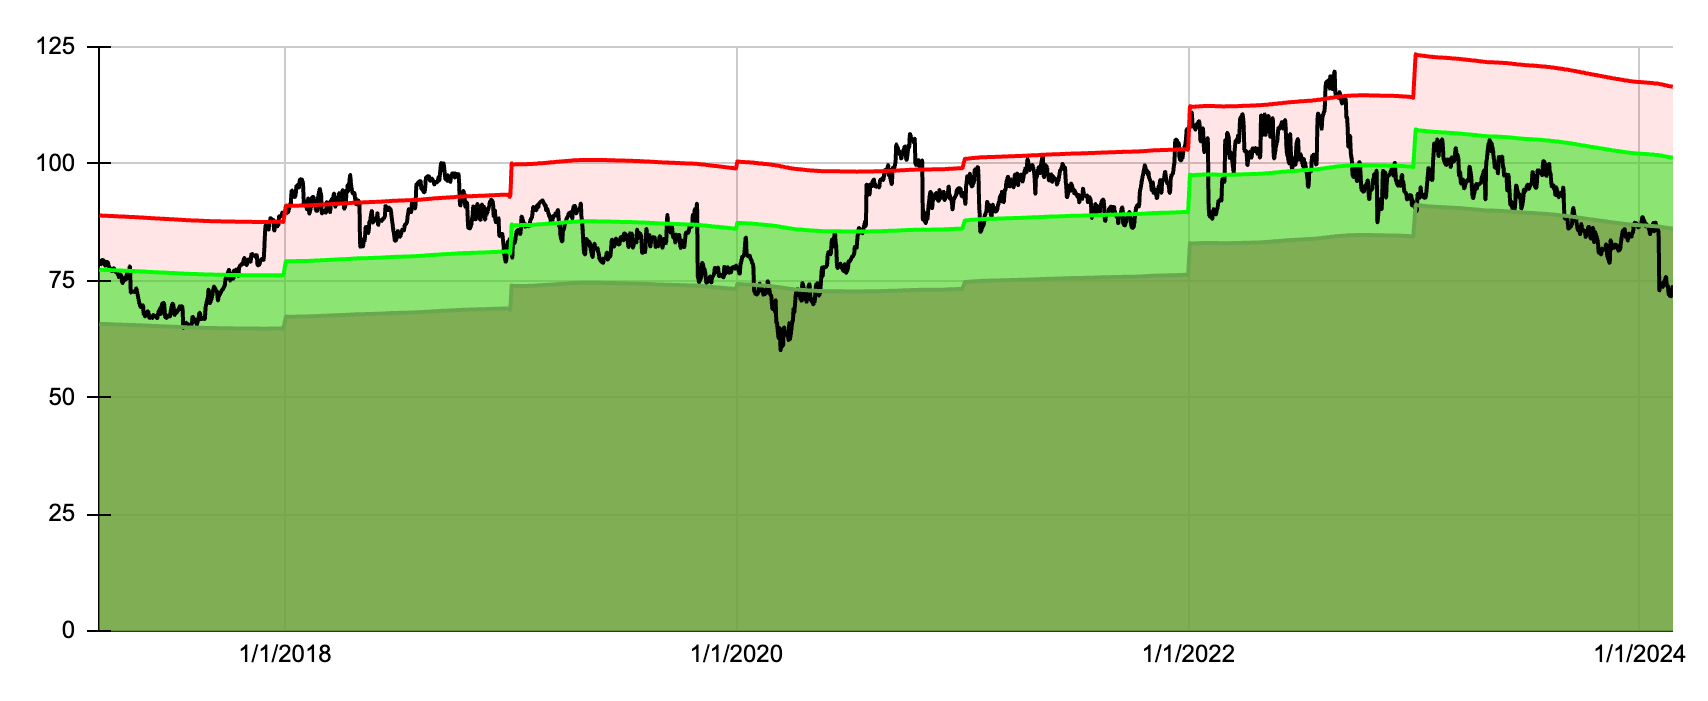
Strategy number 2 is a focus on dividend aristocrats who are expected to grow the fastest in the near future. Historically, there has been a correlation between earnings per share growth and share price appreciation. Companies that have grown their earnings faster have also seen higher total returns. One way to gauge how fast earnings for a company will grow is to leverage analyst forecasts. For this strategy, I decided to use a discounted five-year EPS growth forecast combined with a return to fair valuation and the dividend yield to identify the 10 best aristocrats poised for the best total return in the future.
Month | Fastest Growth | NOBL | SPY |
Aug 21 | 5.12% | 1.87% | 2.98% |
Sep 21 | -4.42% | -5.69% | -4.66% |
Oct 21 | 5.92% | 5.95% | 7.02% |
Nov 21 | -2.06% | -1.76% | -0.80% |
Dec 21 | 7.09% | 6.54% | 4.63% |
Jan 22 | -4.42% | -4.08% | -5.27% |
Feb 22 | -0.10% | -2.59% | -2.95% |
Mar 22 | 3.71% | 3.86% | 3.76% |
Apr 22 | -2.19% | -3.42% | -8.78% |
May 22 | 0.12% | 0.31% | 0.23% |
Jun 22 | -8.94% | -6.73% | -8.25% |
Jul 22 | 6.09% | 6.56% | 4.55% |
Aug 22 | -2.69% | -2.78% | -4.08% |
Sep 22 | -11.37% | -9.15% | -9.24% |
Oct 22 | 13.68% | 10.31% | 8.13% |
Nov 22 | 6.14% | 7.12% | 5.56% |
Dec 22 | -7.53% | -4.12% | -5.76% |
Jan 23 | 9.41% | 3.23% | 6.29% |
Feb 23 | -3.01% | -2.36% | -2.51% |
Mar 23 | -1.79% | 0.99% | 3.71% |
Apr 23 | 0.37% | 2.12% | 1.60% |
May 23 | -7.21% | -5.90% | 0.46% |
Jun 23 | 11.17% | 8.08% | 6.48% |
Jul 23 | 3.00% | 2.59% | 3.27% |
Aug 23 | -1.86% | -2.34% | -1.63% |
Sep 23 | -7.33% | -5.72% | -4.74% |
Oct 23 | -5.30% | -3.49% | -2.17% |
Nov 23 | 9.81% | 6.60% | 9.13% |
Dec 23 | 6.16% | 5.24% | 4.57% |
Jan 24 | 0.61% | -0.47% | 1.59% |
Feb 24 | 2.33% | 2.23% | 5.17% |
2021 Partial | 11.62% | 6.54% | 9.06% |
2022 | -9.86% | -6.50% | -21.65% |
2023 | 11.58% | 8.12% | 26.18% |
2024 | 2.95% | 1.75% | 6.84% |
TOTAL | 15.59% | 9.59% | 15.20% |
Alpha over NOBL | 6.00% | ||
Alpha over SPY | 0.39% |
The table above shows the monthly and annual returns for the buy-and-hold portfolio of the fastest expected growth strategy.
The portfolio outperformed NOBL by 1.08% in January but trailed SPY by 0.98%. February thus far is looking about the same, through February 23rd the portfolio is up 2.33%% (price only return) while NOBL is up 2.23% and SPY is up 5.17%. Since inception, the portfolio maintains a modest level of alpha over both benchmarks, 6.00% over NOBL and 0.39% over SPY.
The fastest expected growth portfolio is currently performing the best out of the 3 strategies. At one point it trailed the most undervalued strategy by a wide margin but it fared much better in the most recent market rally.
The portfolio consists of 36 unique present and former dividend aristocrats. I track this portfolio by investing $1,000 each month equally split amongst the 10 chosen aristocrats for that month. Dividends are reinvested back into the issuing stock and positions are only trimmed if they lose aristocrat status.
Here are the 10 dividend aristocrats poised for the best total return for the month of March 2024. The table below shows the expected growth rate (column EPS + Valuation) for each of the 10 chosen aristocrats.
Created by Author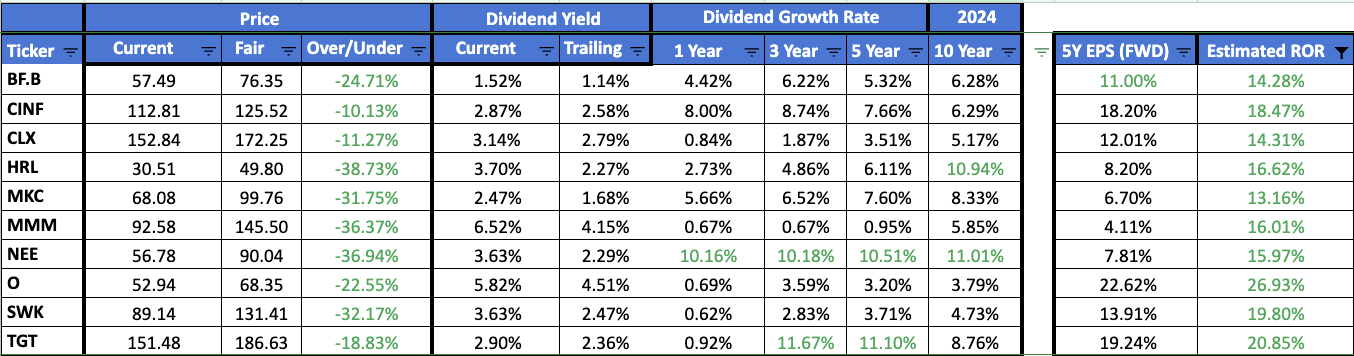
The top 10 list has two changes compared to the prior month. Franklin Resources (BEN) and Ecolab (ECL) drop off and are replaced by Clorox (CLX) and McCormick (MKC).
Here is a closer look at the dividend yield theory valuation for Clorox which looks approximately 11% undervalued.
Created by Author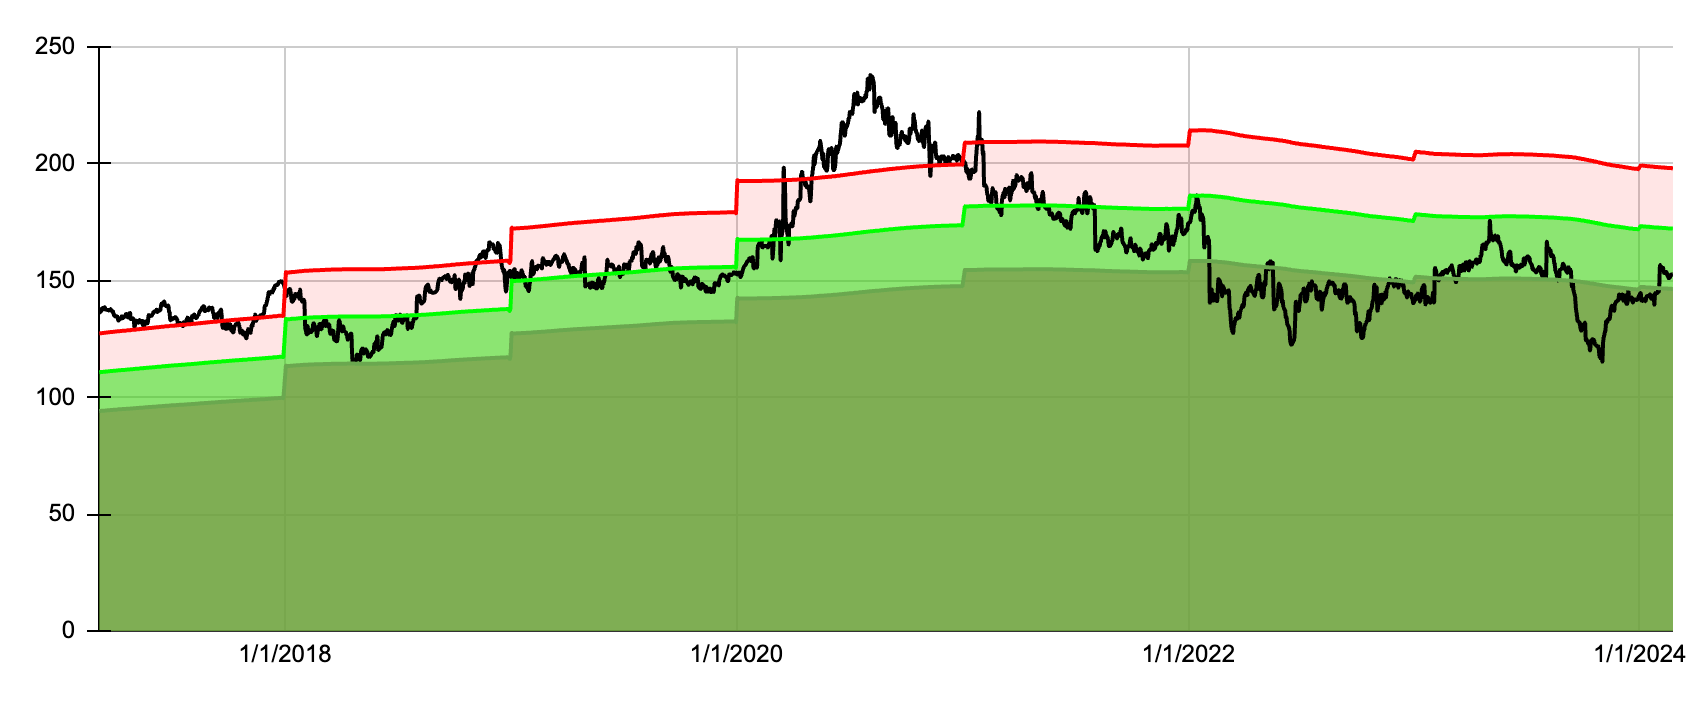
Here is a closer look at the dividend yield theory valuation for McCormick which looks approximately 31% undervalued.
Created by Author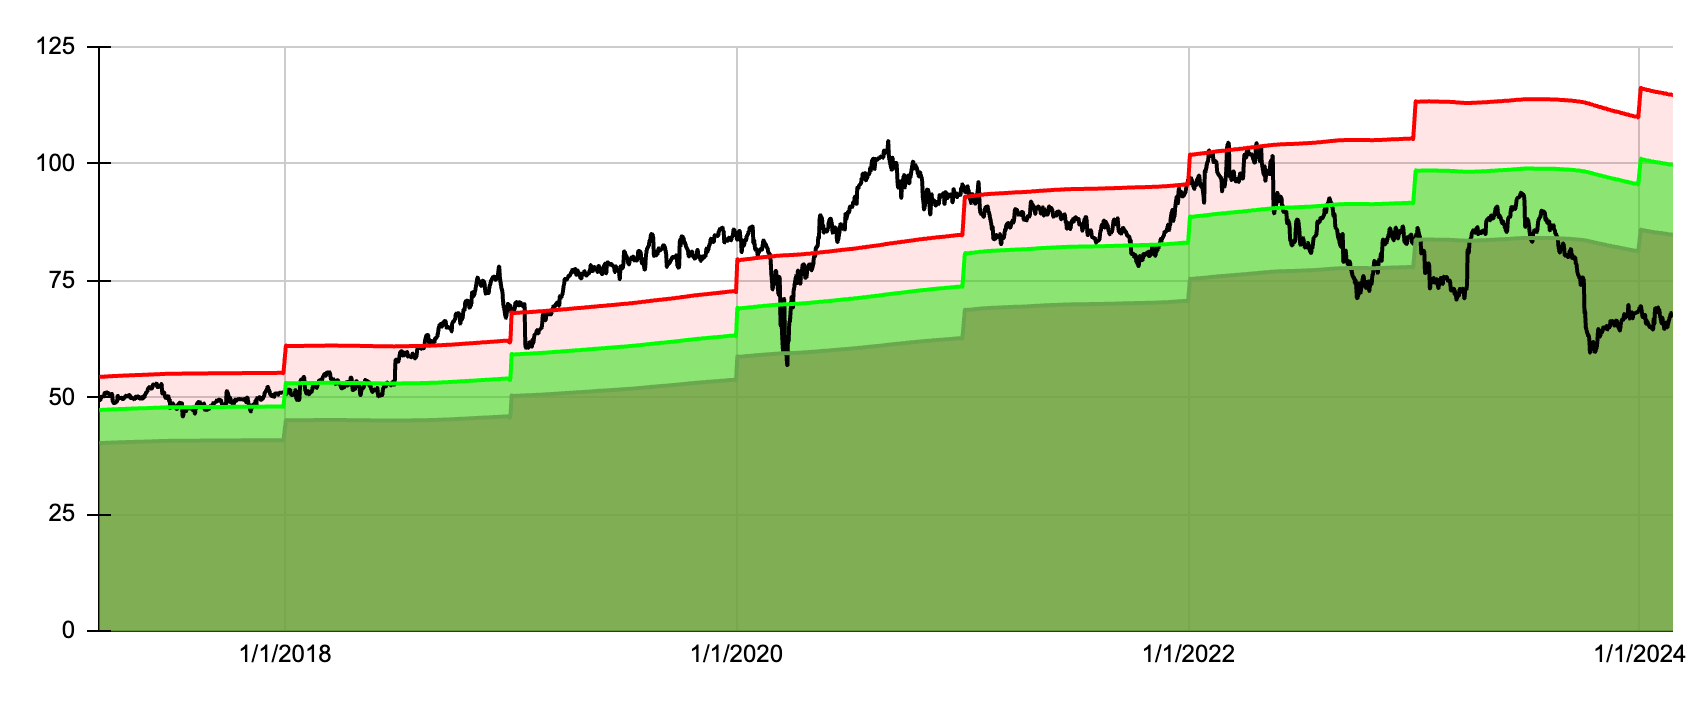
Strategy 3 is a blend of the first two strategies, with a focus on the fastest expected growth but applied only to undervalued aristocrats. A blend of undervaluation and expected growth could narrow down the best aristocrats between the two strategies. The most undervalued aristocrats may not necessarily be poised for the fastest growth. Additionally targeting only undervalued aristocrats can offer a margin of safety in that securities are purchased for fair or better prices.
Month | Blended | NOBL | SPY |
Aug 21 | 2.64% | 1.87% | 2.98% |
Sep 21 | -3.42% | -5.69% | -4.66% |
Oct 21 | 2.70% | 5.95% | 7.02% |
Nov 21 | -2.56% | -1.76% | -0.80% |
Dec 21 | 10.07% | 6.54% | 4.63% |
Jan 22 | -0.71% | -4.08% | -5.27% |
Feb 22 | 0.49% | -2.59% | -2.95% |
Mar 22 | 3.48% | 3.86% | 3.76% |
Apr 22 | -5.04% | -3.42% | -8.78% |
May 22 | 1.28% | 0.31% | 0.23% |
Jun 22 | -6.23% | -6.73% | -8.25% |
Jul 22 | 4.56% | 6.56% | 4.55% |
Aug 22 | -3.29% | -2.78% | -4.08% |
Sep 22 | -10.88% | -9.15% | -9.24% |
Oct 22 | 9.97% | 10.31% | 8.13% |
Nov 22 | 6.38% | 7.12% | 5.56% |
Dec 22 | -5.32% | -4.12% | -5.76% |
Jan 23 | 4.15% | 3.23% | 6.29% |
Feb 23 | -3.45% | -2.36% | -2.51% |
Mar 23 | -0.31% | 0.99% | 3.71% |
Apr 23 | 2.31% | 2.12% | 1.60% |
May 23 | -6.64% | -5.90% | 0.46% |
Jun 23 | 8.48% | 8.08% | 6.48% |
Jul 23 | 3.38% | 2.59% | 3.27% |
Aug 23 | -2.63% | -2.34% | -1.63% |
Sep 23 | -7.33% | -5.72% | -4.74% |
Oct 23 | -3.54% | -3.49% | -2.17% |
Nov 23 | 9.21% | 6.60% | 9.13% |
Dec 23 | 6.44% | 5.24% | 4.57% |
Jan 24 | -1.09% | -0.47% | 1.59% |
Feb 24 | 1.81% | 2.23% | 5.17% |
2021 Partial | 9.18% | 6.54% | 9.06% |
2022 | -7.04% | -6.50% | -21.65% |
2023 | 8.63% | 8.12% | 26.18% |
2024 | 0.70% | 1.75% | 6.84% |
TOTAL | 11.03% | 9.59% | 15.20% |
Alpha over NOBL | 1.44% | ||
Alpha over SPY | -4.16% |
The table above shows the monthly and annual returns for the buy-and-hold portfolio of the blended strategy.
The portfolio underperformed NOBL in January by 0.62% and SPY by 2.68%. February is thus far not looking any better, the portfolio is up 1.81% (price only return) through February 23rd, while NOBL is up 2.23% and SPY is up 5.17%. Since inception, the portfolio is ahead of NOBL by 1.44% but trails SPY by 4.16%.
The blended strategy was an attempt to merge the best of the most undervalued and fastest expected growth strategies. For the longest time, this was the worst-performing strategy, however, since November of 2023 this portfolio slid ahead of the most undervalued portfolio but continues to trail the fastest expected growth portfolio.
The portfolio consists of 39 unique present and former dividend aristocrats. I track this portfolio by investing $1,000 each month equally split amongst the 10 chosen aristocrats for that month. Dividends are reinvested back into the issuing stock and positions are only trimmed if they lose aristocrat status.
Here are the 10 dividend aristocrats chosen for the blended strategy for March 2024. The table below shows potential undervaluation (column Over/Under) and the expected growth rate (column EPS + Valuation) for each of the 10 chosen aristocrats.
Created by Author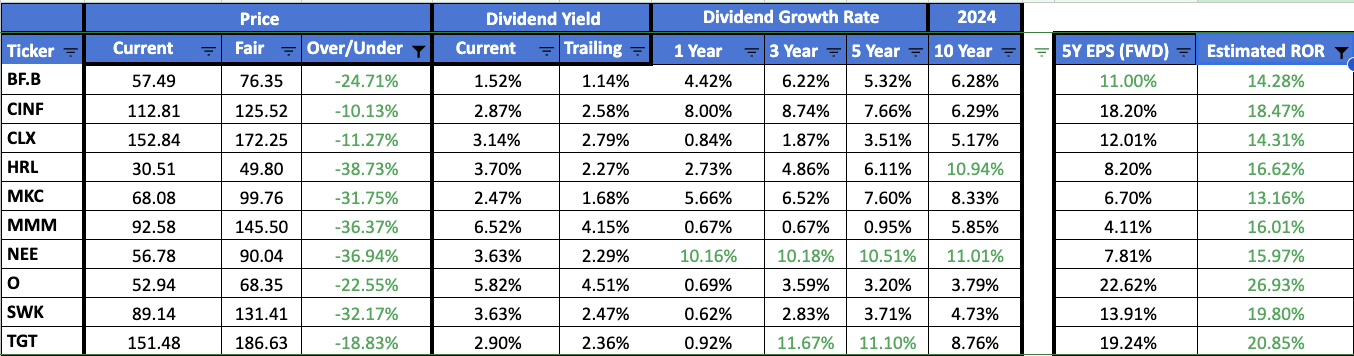
The top 10 list has two changes compared to the prior month, they are exactly the same changes as in the fastest expected growth strategy.
We have already seen how the buy-and-hold strategies are performing in February so now let's look at how the chosen stocks for the month are doing as well. The 10 chosen aristocrats for the most undervalued strategy are up 0.08%, and performing the worst. The fastest expected growth strategy selections are up 1.73%, and since the blended strategy selections for the month were the same, this strategy has the same return. The fastest expected strategy is off to the best start in 2024, year-to-date through February 23rd it has a return of minus 0.08%. Relative to -0.76% for the blended strategy and -3.56% for the most undervalued strategy.
Here is a comparison of the buy-and-hold portfolios and the individual monthly selections for each strategy. A buy-and-hold approach is a much more tax-friendly investing strategy.
Type | Most Undervalued | Fastest Growth | Blended | NOBL |
Individual | -3.05% | 18.75% | 11.77% | 9.59% |
Buy-and-Hold | 7.28% | 15.59% | 11.03% | 9.59% |
O/U | 10.33% | -3.16% | -0.73% | 0.00% |
I personally believe each of the 3 strategies outlined above can theoretically beat the dividend aristocrat index over a long period of time. These strategies are based on simple principles of valuation and expected returns, and they are easy to understand and implement. Investors should keep in mind that selecting individual stocks carries more risk than investing in an index. The simplest and possibly the safest way to invest in the dividend aristocrats is to purchase shares of NOBL. The fund finished 2021 with a fantastic return, performed much better than the S&P in 2022, and posted a respectable gain in 2023. Since inception, the fund has had an annualized rate of return of 10.23% since inception.
2023 was a wild year for dividend stocks but unfortunately, the market was driven by more growth-oriented stocks and companies focused on Artificial Intelligence. I think there is a place for dividend stocks in everyone's portfolio. Dividend investing is a marathon, not a sprint and you will find yourself in a slow period from time to time. The best course of action is to stick with your long-term strategy so long as it still fits your long-term objectives.
The dividend aristocrat data in the images of this article came from my live Google spreadsheet that tracks all of the current dividend aristocrats. Because this data is updated continuously throughout the day, you may notice slightly different data for the same company across the images. Also, some of my returns may be off by a few basis points from those you'll see from other sources on the web.