
Ghing
Ghing
We regularly write about many different types of SWAN (Sleep Well At Night) strategies. One of them is our Near-Perfect Portfolio Strategy. For most people, investing is not a hobby, and it should not have to be one. So, it is understandable that investing should not become an all-consuming activity. In fact, research has proved that less action mostly results in better results. But at the same time, most folks seek either high growth, high current income, or a combination of the two. Investing in broad market indexes like the S&P 500 (SP500) could be a reasonable strategy for younger folks, especially if they are many decades away from retirement.
We will see later in the article that over long periods of time, the S&P 500 can provide reasonable returns, but not without deep drawdowns. However, for income-seeking investors and retirees, it fails on two counts. First, it hardly provides any income, which is the primary objective for income-seeking investors. Second, the ride is usually very bumpy, and the timing of withdrawals can cause a lot of headaches and sometimes serious issues, for example, the sequence-of-returns risk (This usually happens when there is sharp and multi-year correction during the early phase of retirement). (So, the question is how one should form a portfolio that meets its income and growth goals without causing undue stress or anxiety to its owner. That is the purpose of this article.
Everyone's situation is different. However, we can only talk in generalized terms that should represent an average investor. Most folks can not tolerate very large drawdowns in their portfolios, even when they do not need that capital for a long time. Very large drawdowns can create emotionally stressful situations where a person loses the ability to make rational decisions. Fortunately, in the U.S., we haven't had a very deep correction (like the one in 2008-2009) in quite some time. Sure, we had the COVID-induced correction in 2020 when the S&P 500 lost 35% very rapidly but then recovered very quickly from the bottom. The S&P 500 has done extremely well during the last decade and, in fact, has beaten most strategies. But it was not always so, and there is a high probability that it will not be in the future. We cannot say with any certainty if the S&P 500 will provide the same level of returns, or even half of the returns, in the next ten years.
Table-1: 10-Year Annualized returns from the S&P 500, with different starting years:
Author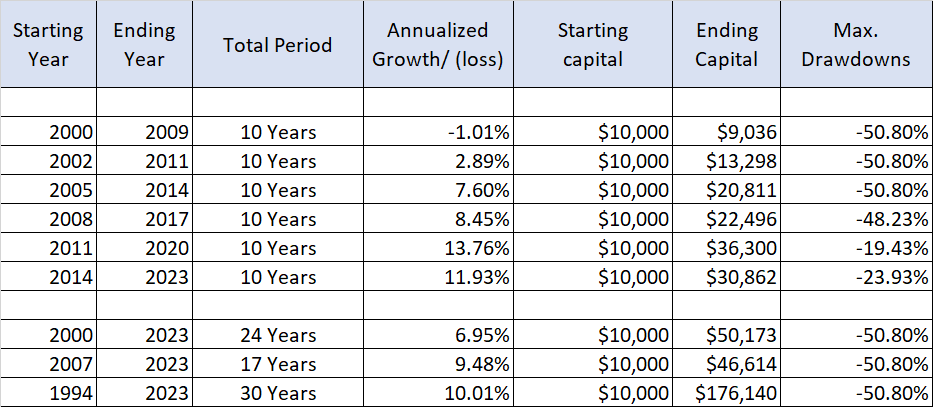
So, the point is that markets are unpredictable, and even if the returns are good for a given period, the ride would be bumpy, sometimes extremely troublesome. To avoid big drawdowns, we should have some kind of hedging mechanism. However, the problem is that most types of hedging come at a cost, which can become significant over long periods of time.
However, we are not talking of a typical hedging mechanism. But we are talking of allocating a portion of your portfolio to a Rotational Strategy that would have an in-built hedging mechanism. Depending upon the type of securities we choose, such a strategy can also provide high growth and/or high income. We will discuss one such strategy in the next section.
The strategy will usually have three buckets; however, based on individual situations, one can have more or less number of buckets. We will explain in a minute. The goals are simple enough:
On the face of it, the goals look ambitious, and we know the portfolio may or may not meet all the goals every year, but the objective is to meet these goals over the long term (10 years or more).
I. DGI - Dividend Growth Investing:
DGI investing is not complicated. We can start with just five stocks, but that is just the minimum; we recommend at least 10-15 stocks for better diversification. In fact, for retirees or conservative investors, the right number may be even more (like 25 stocks).
Now, the first question that comes to mind is how to go about selecting these ten (or more) stocks. It depends upon your goals.
If you are in the accumulation phase when the yield is less important than growth, you need to select more high-growth stocks like Mastercard (MA) and Microsoft (MSFT) than, say, Verizon (VZ) or Realty Income (O). On the reverse, if you are in the withdrawal phase or are soon going to be in one, then we need to select more stocks like Verizon and Realty Income than Mastercard or Visa. If you are somewhere in the middle and want to select ten stocks, go with five dividend-growth stocks and five high-yield stocks. In the same way, if we decide to have 15 stocks, we would recommend five each from high-growth, medium-growth, and high-yield categories.
In this article, we will assume our investor is 50 years old and would like to pursue the middle path. So, we will select ten stocks that would vary from low yield (high growth) to high yield (low growth). We will select three high-growth, three high-yield, and four medium-growth (medium-yield) stocks.
Note: Please note that we are only trying to provide an example of the kind of stocks that this bucket should have. We have not gone into the analysis of whether they are fairly priced at this time or not. So, they should not be treated as buy recommendations as such.
Stocks Included: (ADP), (PEP), (BMY), (ENB), (CCI), (VZ), (DE), (O), (MSFT), and (V).
Table-2: DGI-Bucket Portfolio:
Author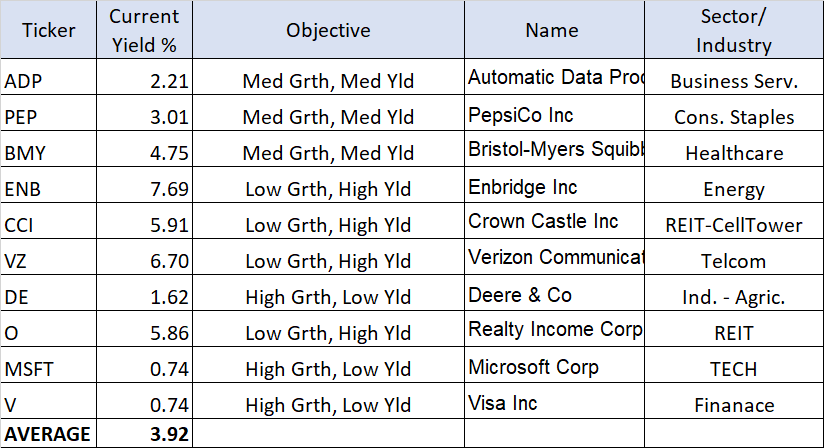
II. High Income Bucket (CEF investing):
This bucket will focus on a very high yield, something of the order of 8% or more. We will select roughly ten funds or stocks that will provide an average yield of 8% - 9%. The idea here is that this bucket will take most of the risk but will also elevate the yield of the overall portfolio by at least 1.5 to 2 percentage points. We would expect some growth (but not a whole lot) from this bucket. Most of our selections will come from CEFs (Closed-end funds), BDCs (Business Development Companies), REITs (Real Estate Investment Trusts), and Energy MLPs (Master Limited Partnerships). Now, this portfolio, as we can see below, provides over 9% yield but may not provide much growth over and above 9%. Sure, if you are in the accumulation phase, you could reinvest the entire income back into the securities to provide you with reasonable growth over time. Sometimes, dripping may be even more beneficial, as some funds provide additional discounts.
Funds Included: (CHI), (MPLX), (HQH), (PDI), (MAIN), (BST), (RNP), (USA), (UTF), and (UTG).
Table-3: High-Income CEF Bucket Portfolio:
Author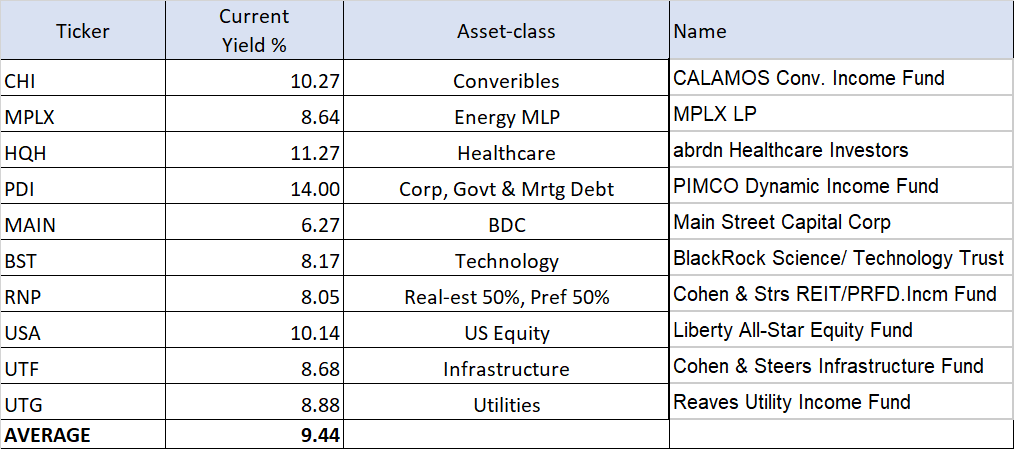
Note: Please note that MPLX is a master limited partnership and provides a K-1 form (partnership income) for tax purposes instead of the usual 1099-DIV.
III. Hedging Bucket (Rotational bucket):
Remember, we started with the goal of having a SWAN (Sleep Well At Night) type of portfolio. We want to have peace of mind while our investment portfolio is working to provide us with high income and decent growth, right? That's where this bucket comes in. This bucket is going to provide some hedging to our overall portfolio and limit the drawdowns to a tolerable level during panics, recessions, and deep corrections. We also call this our "Rotational" bucket.
We can have so many variations of this bucket, and we do provide many different types of Rotational buckets in our Marketplace service. However, for this article, we will provide one such Rotational bucket.
6% Income Asset-Rotational Bucket:
We will have a pool of four securities from different asset classes, from which we will select two of them every month and invest in them. At the end of every month, we will compare the previous three months' total performance of the four securities, select the top two performers, and invest our bucket capital in these two securities in 2/3rd and 1/3rd proportions. That means the security that came first (in terms of performance) will be allocated 66%, and the 2nd one will be allocated 34%. This process will be repeated every month.
List of four securities:
Note: An example of a money market fund would be Fidelity Govt. Money Market Fund (SPAXX). This will ensure that our cash earns some interest payments whenever it is left in the money-market fund.
Backtested performance of the Rotational Bucket:
This bucket performed very well in the backtest that was performed over 18 years from Jan. 2006 to Jan. 2024. It returned 1.5% points higher in annualized returns over the S&P 500, on an average over 18 years. More important was the much lower drawdown of only -18.5% versus -51% from the S&P 500. The volatility was 25% less than the S&P 500.
Chart-1:
Author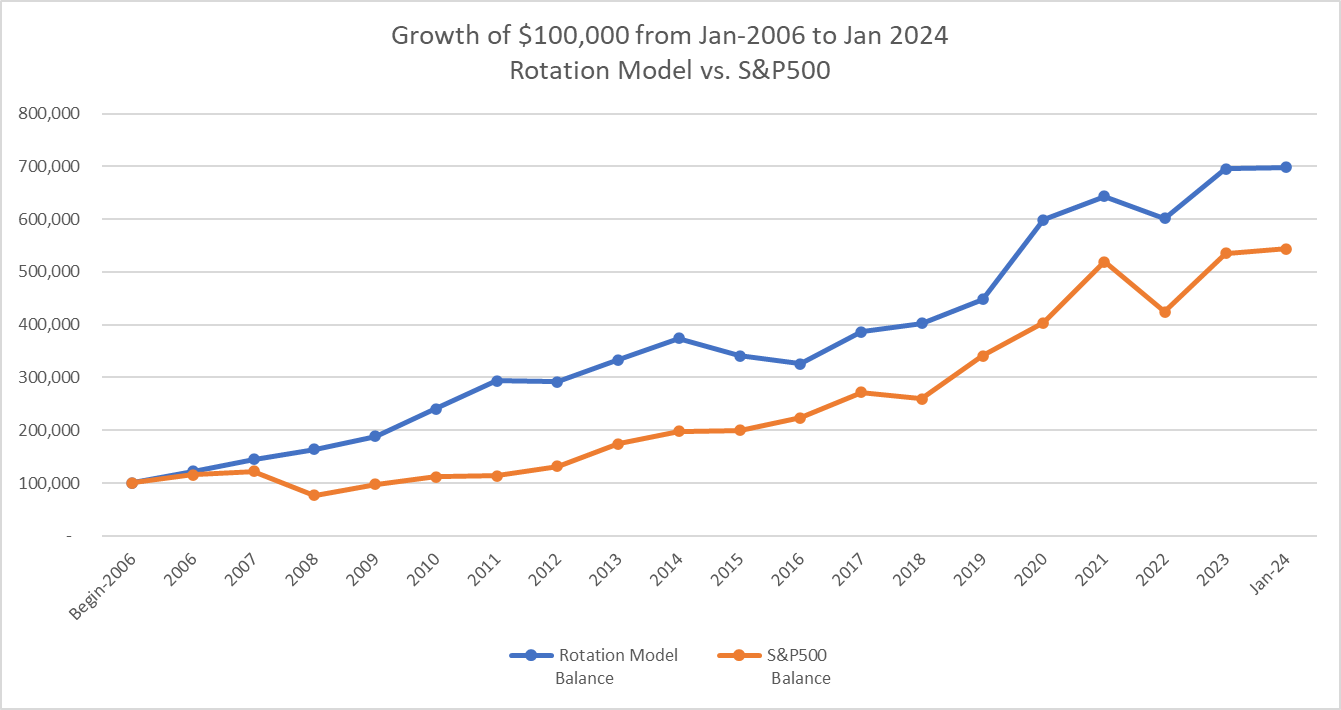
If we were to backtest the performance of this combined portfolio, here are some results from the beginning of 2008. Sure, if we had made this portfolio in 2006, it would not be the same, though it could have been similar. Also, staying with your strategy consistently for a long period of time is not easy and requires a strong conviction. For the purpose of backtesting the DGI and CEF buckets, we had to replace certain securities as they did not have a history for that long. For example, we replaced Visa with Mastercard in the DGI. For the CEF bucket, for prior years, we replaced BST with STK (Columbia Premium Tech Fd), PDI with PTY (PIMCO Corp & Income Opp Fd), etc.
Table-4:
Performance (from Jan. 2008 - Jan. 2024) | 3-Bucket Near Perfect Portfolio** | S&P500 |
Annualized Return [CAGR] | 11.74% | 9.75% |
Growth of $100,000 | $596,400 | $446,376 |
Max. Drawdown | -22.5% | -48.5% |
Std. Deviation | 13.8% | 16.18% |
Market Correlation | 0.63 | 1.0 |
**The allocation ratio for various buckets was taken as 42% DGI, 42% Rotational, and 16% CEF bucket.
No investment strategy can be perfect or risk-free. The strategy described above deploys three separate buckets that have unique goals and objectives. They also have different attributes and tend to behave differently at times, thereby reducing the volatility and maximizing the overall returns. Besides, the overall portfolio has three goals of 5-6% income, greater than 10% total returns, and less than 2/3rd of drawdowns of the S&P 500. We can see from the backtesting results that the strategy met all three objectives and exceeded some.
However, we must keep in mind that these are backtesting results and not real ones. There is always going to be some gap between the two. Moreover, future market conditions can be vastly different than the past 17 years, and that's why past performance can not guarantee the same results. However, based on what we see, it is a highly diversified portfolio, invested in many different sectors and asset classes, providing a very balanced overall portfolio. We believe this portfolio will not only exceed the performance of the S&P 500 but also have less volatility and drawdowns, making it a SWAN-like portfolio.