Darren415
Darren415
In this article, we catch up on the Q4 results of Carlyle Secured Lending (NASDAQ:CGBD). CGBD trades at a dividend yield of 11.7% and a 4% discount to NAV. Its net investment income price yield is 14% - close to 1% above the sector median level.
CGBD has a fairly typical BDC portfolio profile with an 80%+ first lien allocation. Its median company EBITDA of $80m is also in the sweet spot of the middle-market segment. Its sector exposure is tilted toward Business Services and Healthcare - fairly common in the BDC space.
CGBD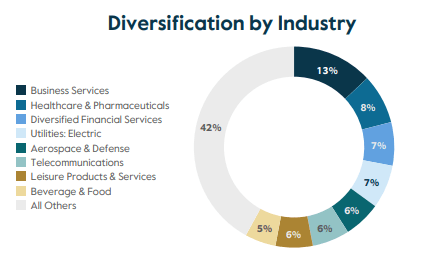
Adjusted net income came in at $0.56 - an increase of close to 8%. This jump is in contrast to a relatively slow pace of net income gains over the past year.
Systematic Income BDC Tool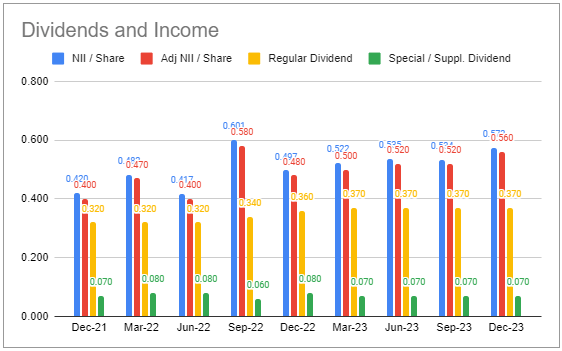
This rise in net income was primarily due to the "Other" bucket which looks to be driven by repayments. This suggests that we could see a drop in net income in the ongoing quarter.
Systematic Income BDC Tool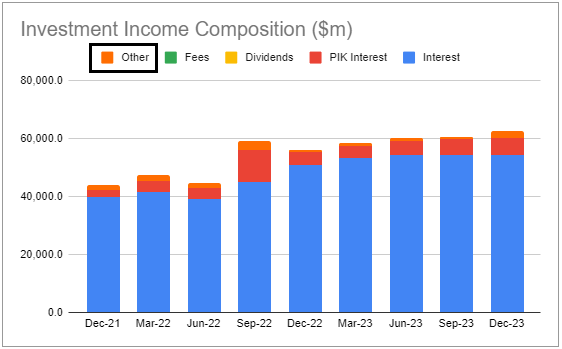
The company boosted the base dividend by over 8% to $0.40 and increased the supplemental by a penny. Total dividend coverage works out to 117%.
CGBD also introduced a new supplemental dividend framework - in line with what several other BDCs have done such as OBDC and GBDC. Specifically, the company will pay out at least half of the excess net income (i.e. adjusted net income less base dividend) through the supplemental dividend.
The NAV rose for the second quarter in a row - by around 0.8%.
Systematic Income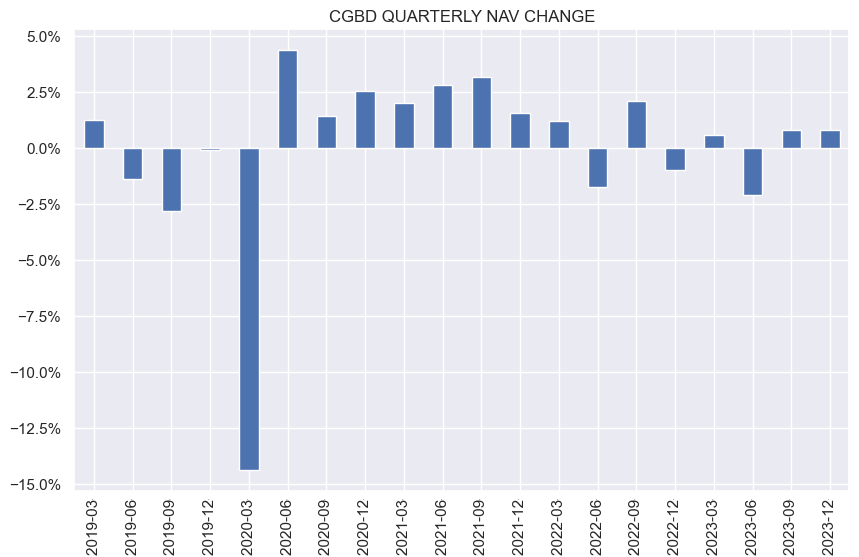
This was primarily a result of retained net income. Over the full year, the NAV was flat.
CGBD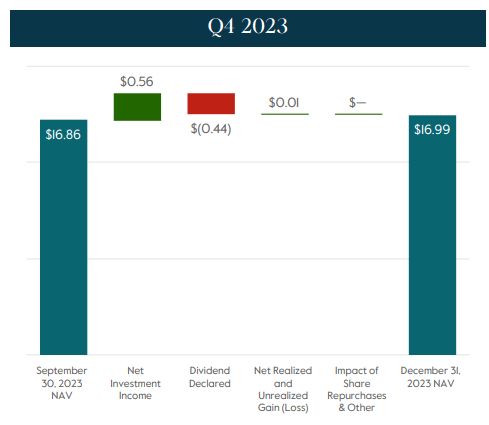
Over a longer time frame, the NAV has been relatively resilient. It is on par with where it was prior to the COVID period - a good result for investors.
Systematic Income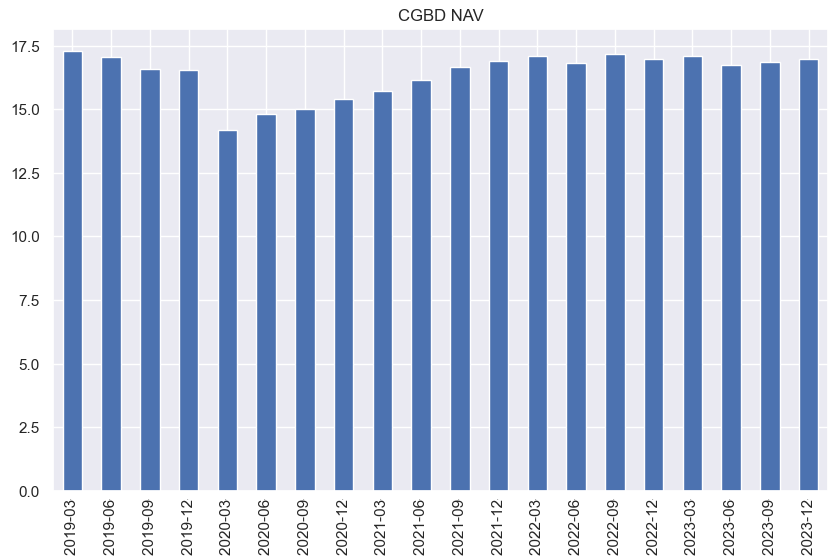
Net new investments came in negative for the fourth quarter in a row. Management discussed that credit spreads have tightened while deal flow has slowed, creating a more difficult environment for lenders.
Systematic Income BDC Tool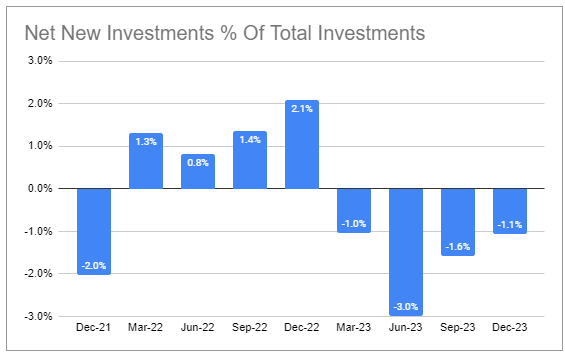
As a result, leverage continued to tick lower. It is at the lower end of the target range.
Systematic Income BDC Tool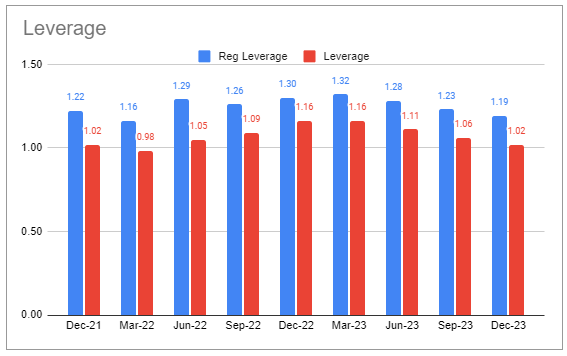
Asset yields have flatlined however interest expense has increased a bit. This is likely due to the company's latest bond issue whose coupon is above that of the other liabilities. The 8.2% fixed coupon issue was swapped to SOFR + 3.14% which works out to around 8.4%. This is on the high side of the rest of the sector.
Systematic Income BDC Tool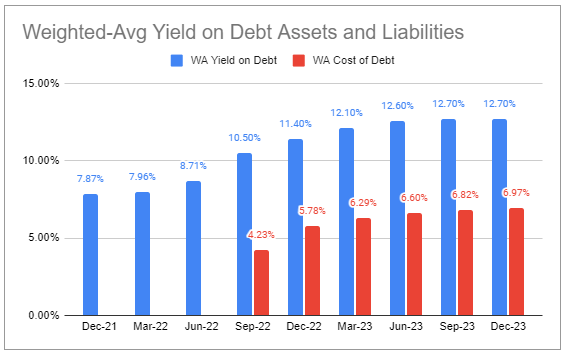
Another headwind is that the yield of new investments fell below that of the previous quarter. It was also below that of the yield on repayments.
CGBD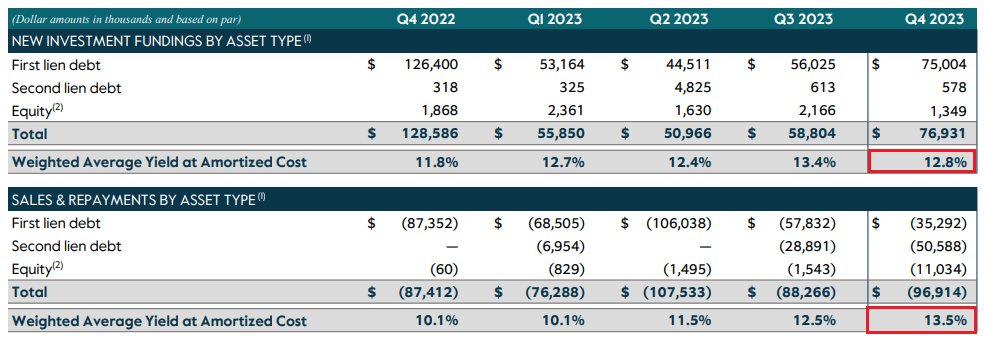
As we have discussed previously, the company's net income profile was going to rise at a slower pace than the rest of the sector and that is indeed how it has played out. That said, what was a liability in a rising rate environment (such as its greater floating-rate financing profile) can be an asset in a period of Fed rate cuts. Going forward, the company's net income should not lag the sector as much as it has in the last couple of years.
There were no new non-accruals this quarter and no additions to the watchlist i.e. investments in the two worst-rated buckets. One holding was recapitalized and should come off non-accrual this quarter.
Systematic Income BDC Tool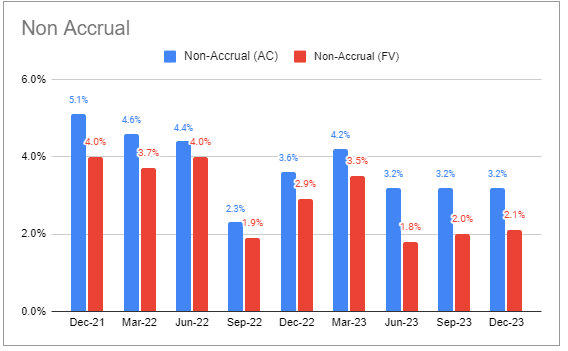
PIK ticked up to close to 10% - above the average level. Management said that in most cases where PIK relief was provided it was accompanied by equity support from the sponsor as well.
Portfolio quality as shown by internal ratings was stable. The uptick in the lowest-quality buckets appears to be due to an improvement in the profile of existing companies in those buckets rather than new entrants into those buckets.
Systematic Income BDC Tool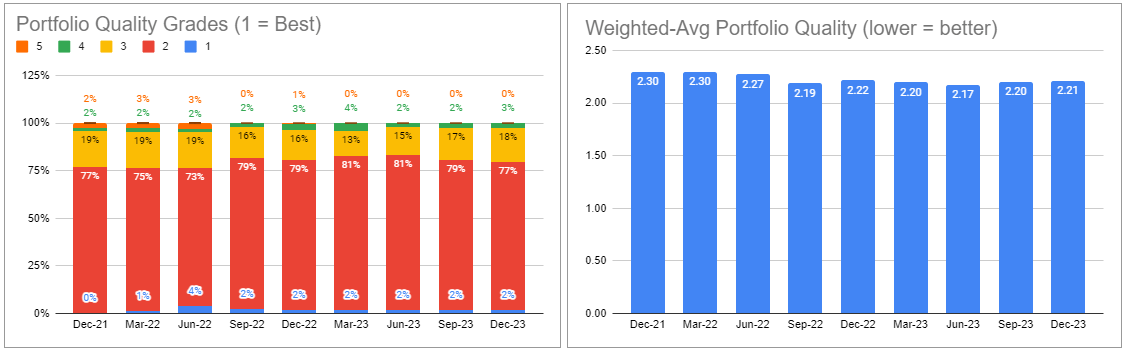
Net realized gains/losses have been flat for two quarters - good to see after two previous net loss quarters.
Systematic Income BDC Tool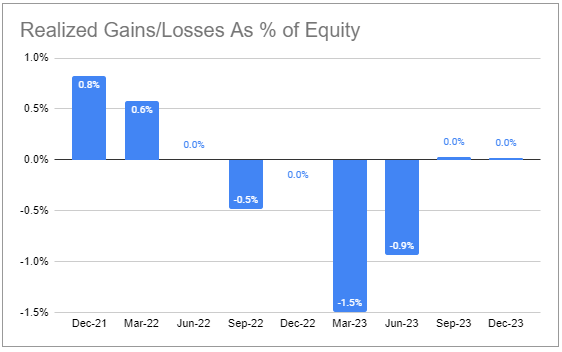
Overall, portfolio quality is holding up well - in contrast to a number of BDCs that are struggling. CGBD has never boasted a higher-quality portfolio however it has come through a challenging two-year period pretty well.
The company's performance trend has been very good. The trailing-twelve month average of quarterly total NAV returns has not moved much below zero since mid-2020.
Systematic Income BDC Tool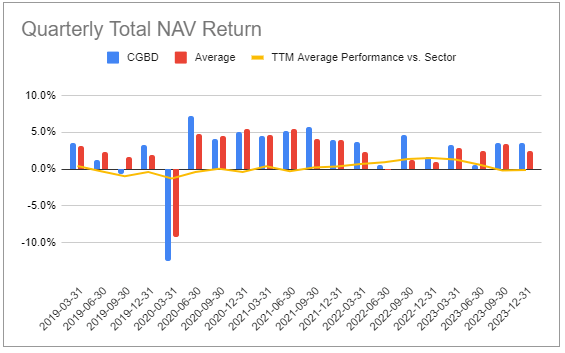
This has translated into significant outperformance against the sector on a 3-year basis and slight underperformance over the past year.
Systematic Income BDC Tool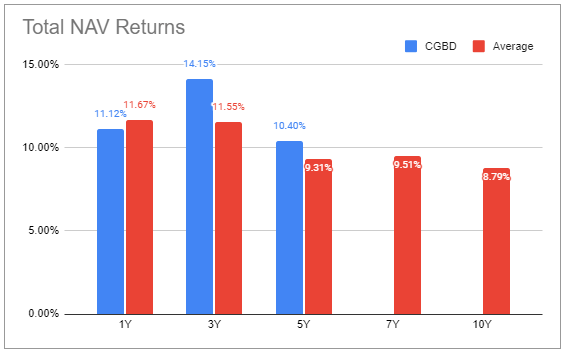
Given this run of performance, the stock is now trading at the highest valuation since mid-2018.
Systematic Income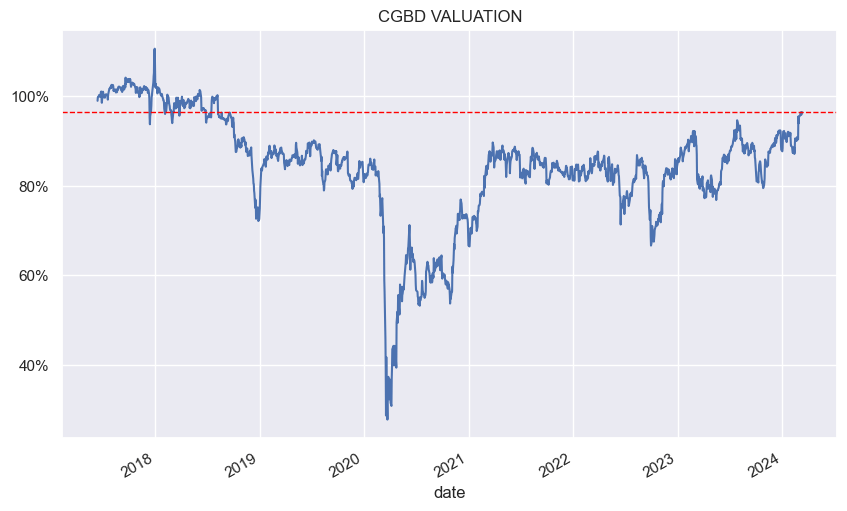
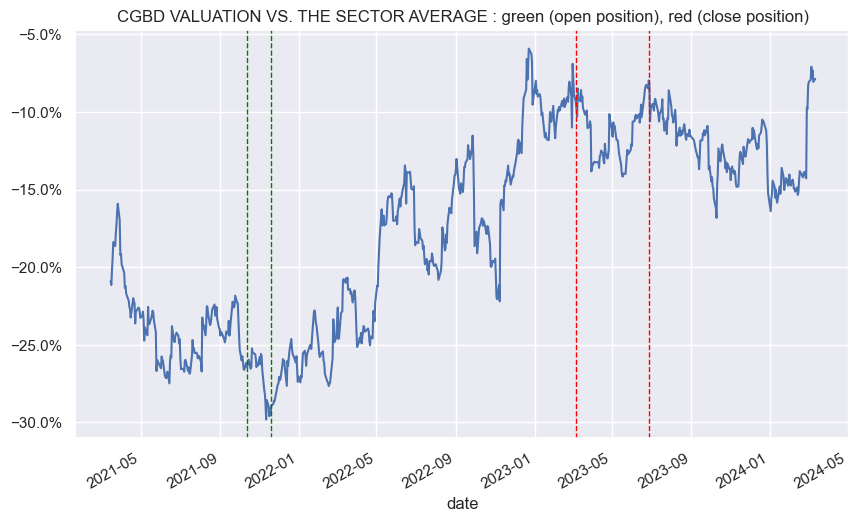
The valuation has also improved relative to the sector with the stock trading near its tightest valuation to the broader sector in several years.
Systematic Income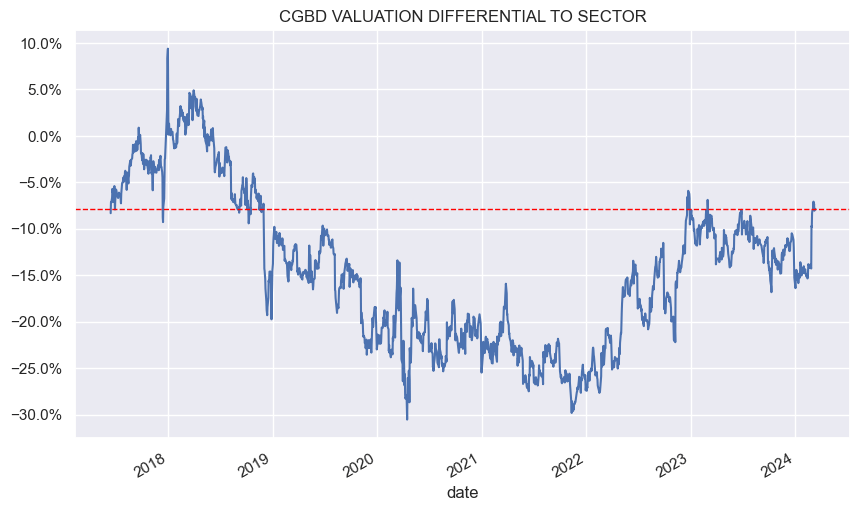
At this point, CGBD offers less of a slam-dunk allocation. We added to our position when the valuation traded at levels 25-30% below the average (green lines). We then downsized the position when the valuation closed to a single-digit discount to the average sector valuation. Although we continue to have a stub position in the stock, we would look for a double-digit relative discount before adding.
Systematic Income