
Olivier Le Moal
Olivier Le Moal
In this monthly article, we try to identify five closed-end funds ("CEFs") that have a solid historical performance, pay high enough distributions, and offer reasonable valuations at the current time. We also present a more diversified list of the top 10 funds.
Author's Note: This article is part of our monthly series that tries to discover the five best buys in the CEF arena at that point in time. Certain parts of the introduction, definitions, and sections describing selection criteria/process may have some commonality and repetitiveness with our other articles in this series. This is unavoidable and intentional to keep the entire series consistent and easy to follow for new readers. Regular readers who follow the series from month to month could skip the general introduction and sections describing the selection process (please skip to "Narrowing Down To 50 Funds").
For income-focused investors, closed-end funds remain an attractive investment class that offers high income (generally in the range of 6 to 10%, often 8% plus), broad diversification (in terms of the number of holdings and variety of asset classes), and market-matching total returns in the long term, if selected carefully and acquired at reasonable price points. A $500K CEF portfolio can generate nearly $40,000 yearly compared to a paltry $8,000 from the S&P 500. Now, if you were a retiree and needed to use all of the income (generated by the CEF portfolio), the portfolio probably would grow marginally or not grow much. Even then, it beats investment vehicles like annuities without some of their downsides. However, if you can withdraw 5% or less while re-investing the rest of the yield into the original fund (or new funds), the total return could exceed 10% over a long period.
That said, the goal here is to earn a high income or boost the income yield of an otherwise diversified portfolio. If your current spending needs are comfortably met with less than 3% income yields, you may be better served with a well-diversified traditional DGI (dividend growth investing) portfolio instead. We also write a monthly series to identify "5 Safe and Cheap DGI" stocks. You can read our most recent article here.
Nevertheless, if you are an investor in CEFs, it's important to be aware of the risks and challenges of investing in CEFs. We list various risk factors and how to mitigate them towards the end of this article. Like most other investments, these investments are not suitable for everyone, so please carefully consider your goals, income needs, and risk tolerance.
As such, CEFs provide higher yields than other types of investments or typical dividend stock. It is very important that we do not chase high yields or distributions; rather, we should compare a host of metrics to judge if a fund would be a good investment. We should invest in funds that have a proven history of good performance. Besides, we should try to buy them when offered at reasonable discounts (discount to NAV). We should generally avoid funds that are trading at premiums. In addition, it is of utmost importance that we diversify our CEF portfolio in terms of underlying asset classes. This is why we recommend having at least ten positions in the CEF portfolio. Besides, income investors need to make a judgment that distributions are sustainable.
Market uncertainties will always remain with us. It's best to keep the focus on our long-term goals and strategies that have proven to work in good times and bad. If you are a new investor and/or starting a brand-new CEF portfolio, we recommend starting small and building the positions over time. We believe that a 20-25% allocation to closed-end and high-income funds should be enough for most investors.
This series of articles attempts to separate the wheat from the chaff by applying a broad-based screening process to 500 CEF funds followed by an eight-criteria weighting system. Ultimately, we're presented with about 30-40 of the most attractive funds to select the best five. However, please note that we do not consider funds with fewer than five years of history. We use our multi-step filtering process to select just five CEFs from around 500 available funds. We also include a list of the top 10 funds for readers looking for a wider selection and diversification.
This is our regular series on CEFs, where we highlight five CEFs that are relatively cheap, offer "excess" discounts to their NAVs, pay reasonably high distributions, and have a solid track record.
The selected five CEFs this month, as a group, are offering an average distribution rate of nearly 9.43% (as of 02/16/2024). Besides excellent distributions, these five funds have a proven past record over the short and the long term and collectively returned 10.60%, 10.78%, and 8.85% in the last three, five, and ten years. The leverage for the group, on average, is reasonable, at 12.5%. The current average discount (to NAV) is also very attractive, roughly at -13%. Since this is a monthly series, some selections may overlap from month to month.
Please note that these are not recommendations to buy, but should be considered as a starting point for further research.
Our goals are simple and are aligned with most conservative income investors, including retirees who wish to dabble in CEFs. We want to shortlist five closed-end funds that are relatively cheap, offer good discounts to their NAVs, pay relatively high distributions, and have a solid and substantial past track record in maintaining and growing their NAVs. Please note that we are not necessarily going for the cheapest funds (in terms of discounts or highest yields) but also require our funds to stand out qualitatively. We adopt a systematic approach to filter down the 500-plus funds into a small subset.
Here's a summary of our primary goals:
We believe a well-diversified CEF portfolio should contain at least 10 CEFs, preferably from different asset classes. It's also advisable to build the portfolio over a period rather than invest in one lump sum. If you were to invest in one CEF every month for a year, you would have a well-diversified CEF portfolio by the year's end. What we provide here every month is a list of five probable candidates for further research. A CEF portfolio can be an important component of the overall portfolio strategy. One should preferably have a DGI portfolio as the foundation, and the CEF portfolio could be used to boost the income level to the desired level. How much should one allocate to CEFs? Each investor needs to answer this question himself/herself based on his/her personal situation and factors like the size of the portfolio, income needs, risk appetite, or risk tolerance.
We have more than 500 CEF funds, which come from different asset classes like equity, preferred stocks, mortgage bonds, government and corporate bonds, energy MLPs, utilities, infrastructure, and municipal income. Just like in other life situations, even though the broader choice is always good, it makes it more difficult to make a final selection. We first want to shorten this list of 500 CEFs to a more manageable subset of around 75-100 funds. We can apply some criteria to shorten our list, but the criteria need to be broad and loose enough at this stage to keep all the potentially good candidates. Also, the criteria that we build should revolve around our original goals. We also demand at least a five-year history for the funds that we consider. However, we do take into account the 10-year history, if available.
Criteria | Brings down the number of funds to... | Reason for the Criteria |
Baseline expense < 2.5% and Avg. Daily Volume > 10,000 | Approx. 435 Funds | We do not want funds that charge excessive fees. Also, we want funds that have fair liquidity. |
Market capitalization> 100 Million | Approx. 400 Funds | We do not want funds that are too small. |
Track record/ History longer than five years (inception date 2016 or earlier) | Approx. 375 Funds | We want funds that have a reasonably long track record. |
Discount/Premium < +7% | Approx. 350 Funds | We do not want to pay too high a premium; we want bigger discounts. |
Distribution (dividend) Rate > 5% | Approx. 250-290 Funds | The current distribution (income) is reasonably high. |
| 5-Year Annualized Return on NAV > 0% AND 3-Year Annualized Return on NAV >0% | Approx. 200-220 Funds | We want funds with a reasonably good past track record in maintaining their NAVs. |
After we applied the above criteria this month, we were left with 234 funds on our list. From here on, we apply our other criteria to narrow the list.
Note: All tables in this article have been created by the author (unless explicitly specified). Most of the data in this article are sourced from Cefconnect.com, Cefa.com, and Morningstar.com.
To narrow down the number of funds to a more manageable count, we will shortlist ten funds based on each of the following criteria. After that, we will apply certain qualitative criteria to each fund and rank them to select the top five.
At this stage, we also eliminate certain funds with substantial negative NAV returns for both three-year and five-year periods.
We certainly like funds that are offering large discounts (not premiums) to their NAVs. But sometimes, we may consider paying near zero or a small premium if the fund is otherwise great. So, what's important is to look at the "excess discount/premium" and not the absolute value. We want to see the discount (or premium) relative to their record, say 52-week average.
Subtracting the 52-week average discount/premium from the current discount/premium will give us the excess discount/premium. For example, if the fund has the current discount of -5%, but the 52-week average was +1.5% (premium), the excess discount/premium would be 6.5%.
Excess Discount/Premium = Current Discount/Premium (Minus) 52-Wk Avg. Discount/ Premium.
So, what's the difference between the 12-month Z-score and this Excess Discount/Premium measurement? The two measurements are quite similar, maybe with a subtle difference. The 12-month Z-score would indicate how expensive (or cheap) the CEF is in comparison to the 12 months. The Z-score also takes into account the standard deviation of the discount/premium. Our measurement (excess discount/premium) compares the current valuation with the last 12-month average.
We sort our list (of 234 funds) on the "excess discount/premium" in descending order. For this criterion, the lower the value, the better it is. So, we select the top 10 funds (most negative values) from this sorted list.
(All data as of 02/16/2024.)
Table 1:
Author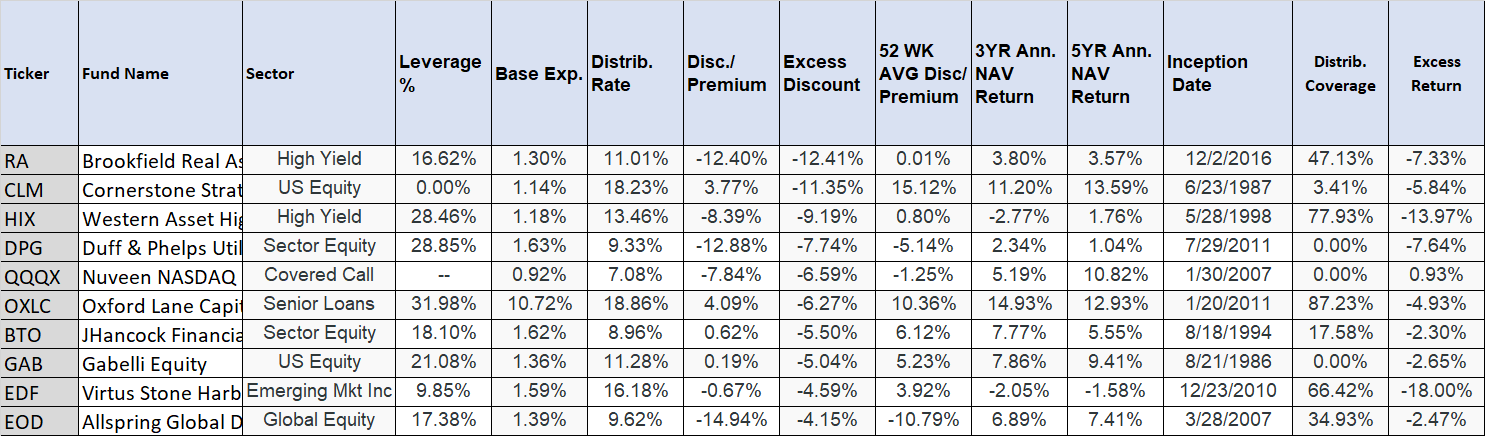
After all, most investors invest in CEF funds for their juicy distributions. We sorted our list on the current distribution rate (descending order, highest at the top) and selected the top 10 funds from this sorted list.
Table 2:
Author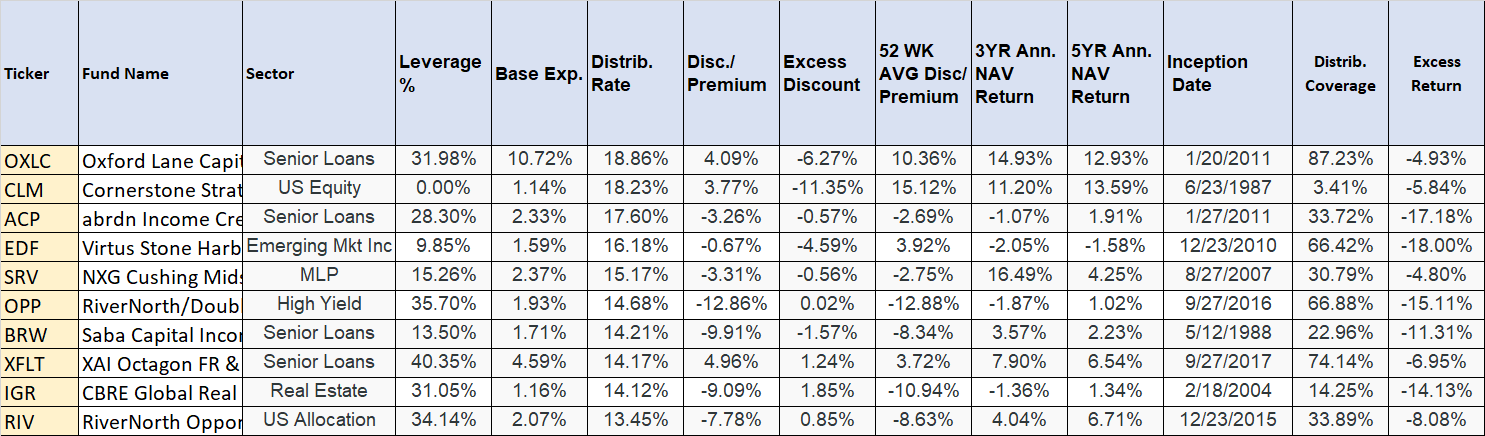
We then sort our list on a three-year return on NAV (in descending order, highest at the top) and select the top 10 funds. Please note that too many MLP funds topped the list this month (and the past few months) on the 3-year performance list, but they were still negative or flat over 5-year or 10-year periods. For this reason, we kept only a couple of them on this list.
Table 3:
Author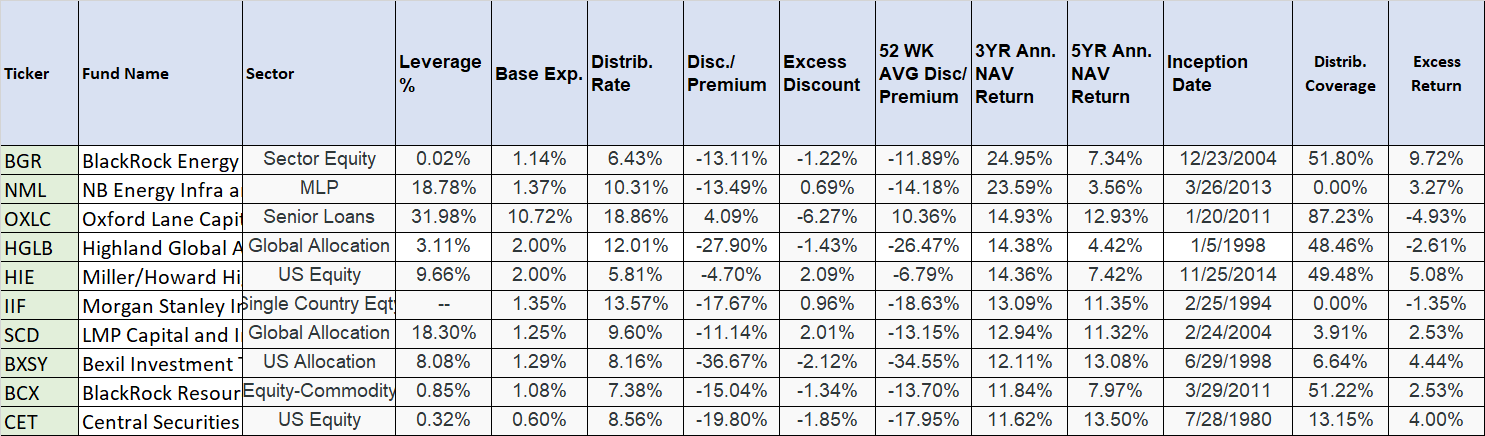
We then sorted our list on the five-year return on NAV (in descending order, highest at the top) and selected the top 10 funds.
Table 4:
Author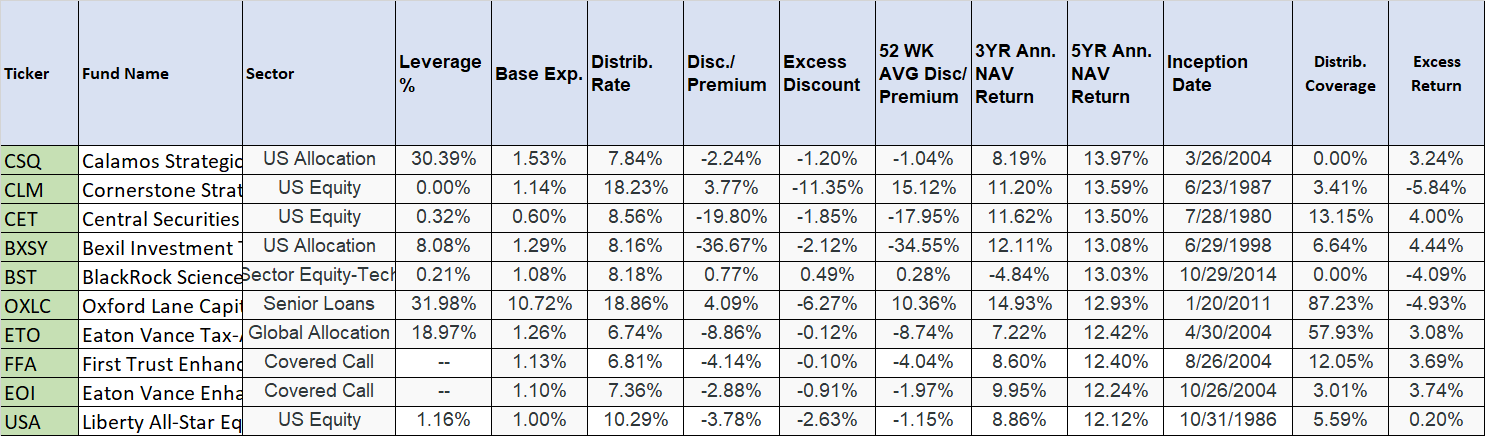
The coverage ratio is derived by dividing the earnings per share by the distribution amount for a specific period. Please note that in some cases, the coverage ratio may be a bit inaccurate since the "earnings per share" may be three to six months old. But in most cases, it's fairly accurate. Also, the coverage ratio is not very important for pure equity funds as they generate very little dividend income, and they cover most of their distributions from capital gains. So, we sorted our list on the coverage ratio and selected the top 10 funds.
Table 5:
Author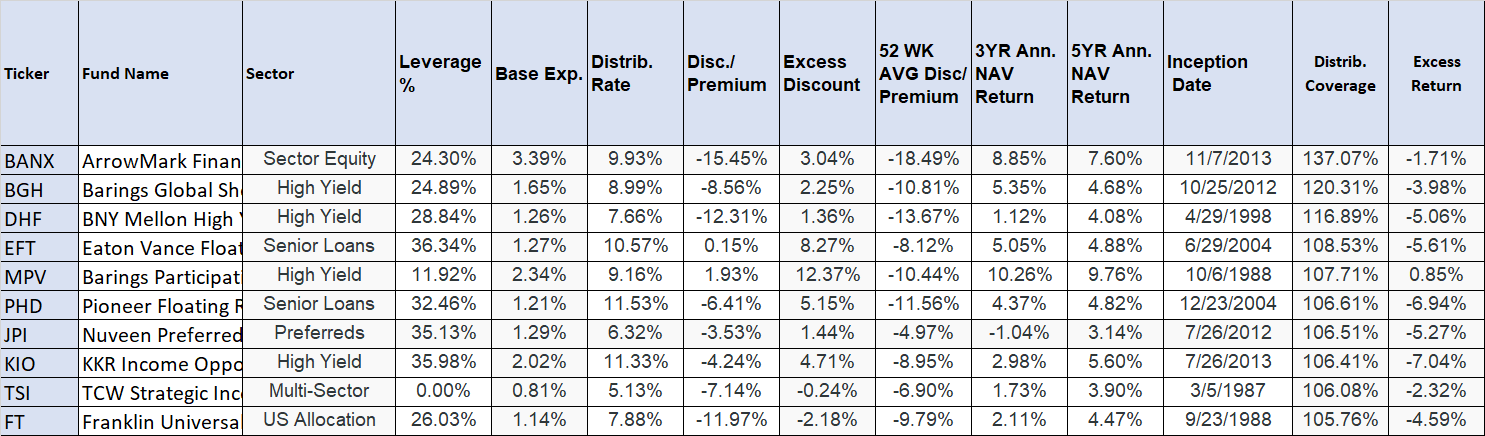
If a fund provides a very high distribution but low returns over 3, 5, or 10-year periods, it does not help the long-term interests of the investor. That is why we calculate a factor we like to call "excess return." This excess return is what is provided by the fund over and above the distribution rate over a specified time period. We calculate it by subtracting the distribution rate from the three-year NAV return. In this list, we included the top 10 funds.
Table 6:
Author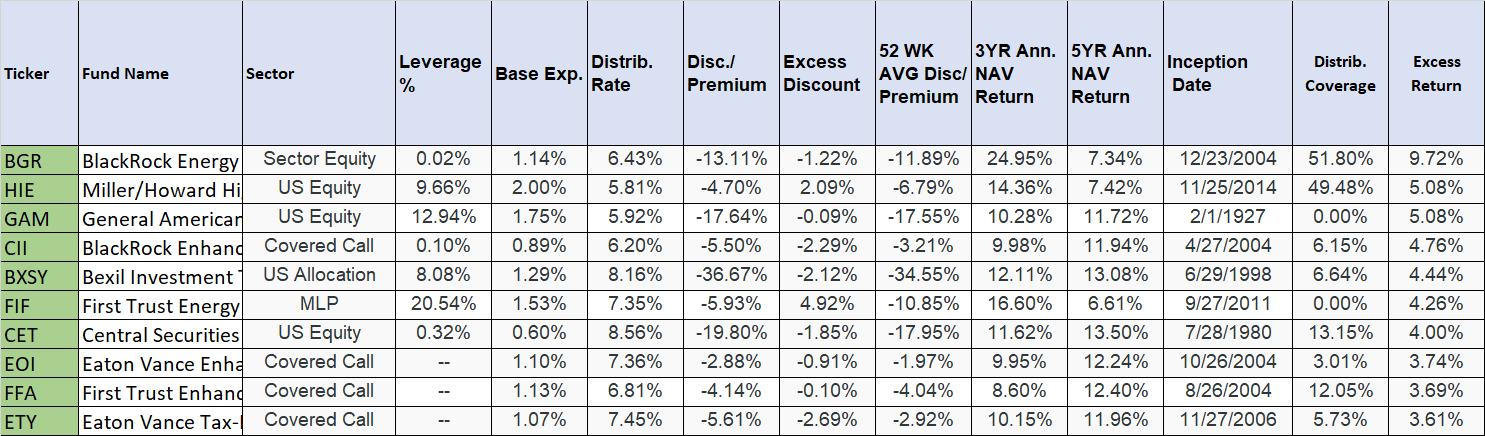
Note: The Total Weight calculation is not fully completed at this point, since we have not considered the 10-year NAV return. Also, we will need to adjust the weight for the coverage ratio at a later stage. However, we select the top 15 names based on current calculations.
Table 7:
Author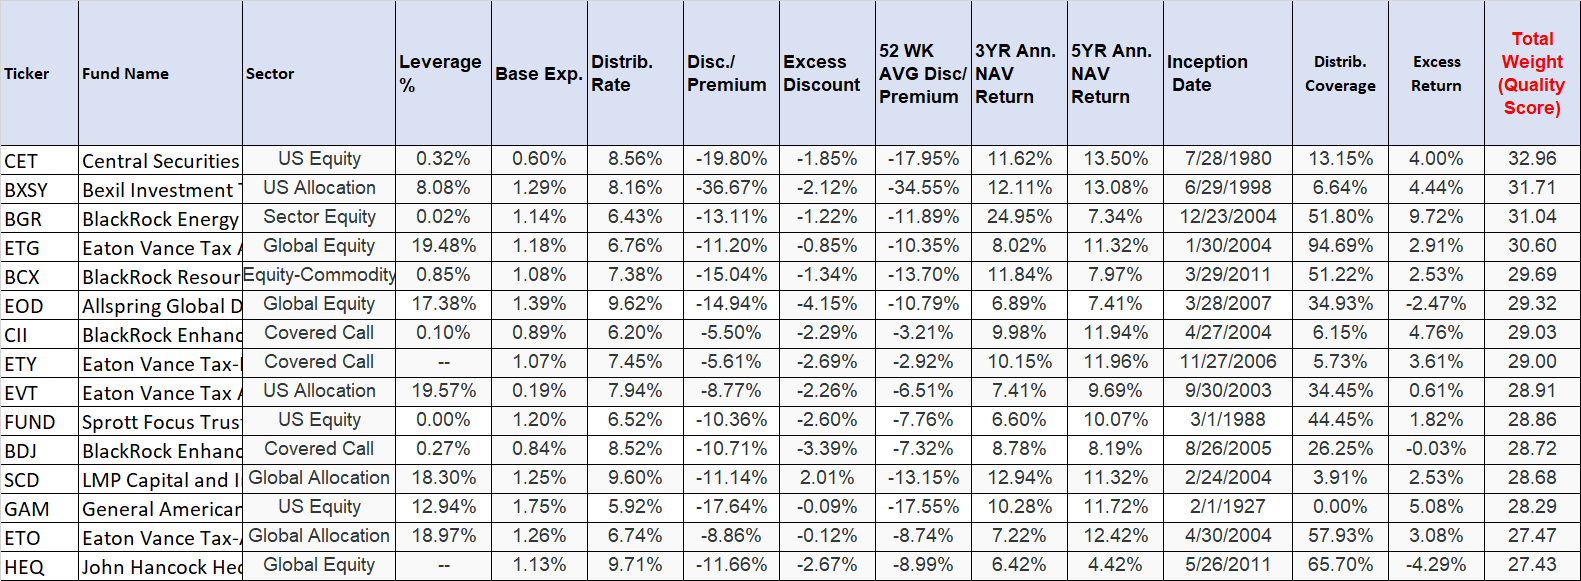
From the above selections, we now have 75 funds in total (tables 1-7).
We will need to see if there are any duplicates among them. In our current list of 75 funds, there were 24 duplicates, meaning there are funds that appeared more than once. The following names appear twice (or more):
Appeared two times: BCX, CII, EDF, EOD, EOI, ETO, ETY, FFA, GAM, HIE, SCD (11 duplicates).
Appeared three times: BGR, CLM (4 duplicates).
Appeared four times: BXSY, CET, OXLC (9 duplicates).
So, once we remove 24 duplicate rows, we are left with 51 (75 - 24) funds.
Note: It may be worthwhile to mention here that just because a fund has appeared multiple times does not necessarily make it an attractive candidate. Sometimes, a fund may appear multiple times simply for the wrong reasons, like a high current discount, high excess discount, or a very high distribution rate that may not be sustainable. However, during the second filtering stage, it may not score well on the overall quality score due to other factors like poor track record. That said, if a fund has appeared four times or more, it may be worth a second look.
In our list of funds, we already may have some of the best probable candidates. However, so far, they have been selected based on one criterion that each may be good at. That's not nearly enough. So, we will apply a combination of criteria by applying weights to eight factors to calculate the total quality score and filter out the best ones.
We will apply weights to each of the eight criteria:
Once we have calculated the weights, we combine them to calculate the "Total Combined Weight," also called the "Quality Score."
The sorted list (spreadsheet) of 51 funds on the "combined total weight" is attached here:
File-for-export_-_5_Best_CEFs_-_Feb_2024.xlsx
Before we get to the final five, we will narrow down our list from 51 names to 20 names. So, we sorted our table of over 50 names based on sector and then the quality score. Also, in this round of selections, we mostly pick one or two top funds from each sector (based on quality score). There is a bit of subjective judgment, as we tend to prioritize funds that pay regular and consistent distributions on a monthly or quarterly basis. We also weed out any fund that may have a very poor track record in terms of NAV performance. Funds that may have inconsistent dividends (even if they are high) generally do not make it to our top list.
Also, be aware that many times, single-country funds score high in our rankings, but a majority of them pay variable dividends on an annual or semi-annual basis. In addition, being single-country funds, they can be inherently riskier since their future returns are tied to just one country, be it economic, regulatory, or geopolitical factors. So, for these reasons, they generally do not make it to our top 5 lists, but they do appear on our list of 20. Individual investors could consider them based on their goals.
Here's the list of the top 20 selections (from different asset classes):
Table 8:
Author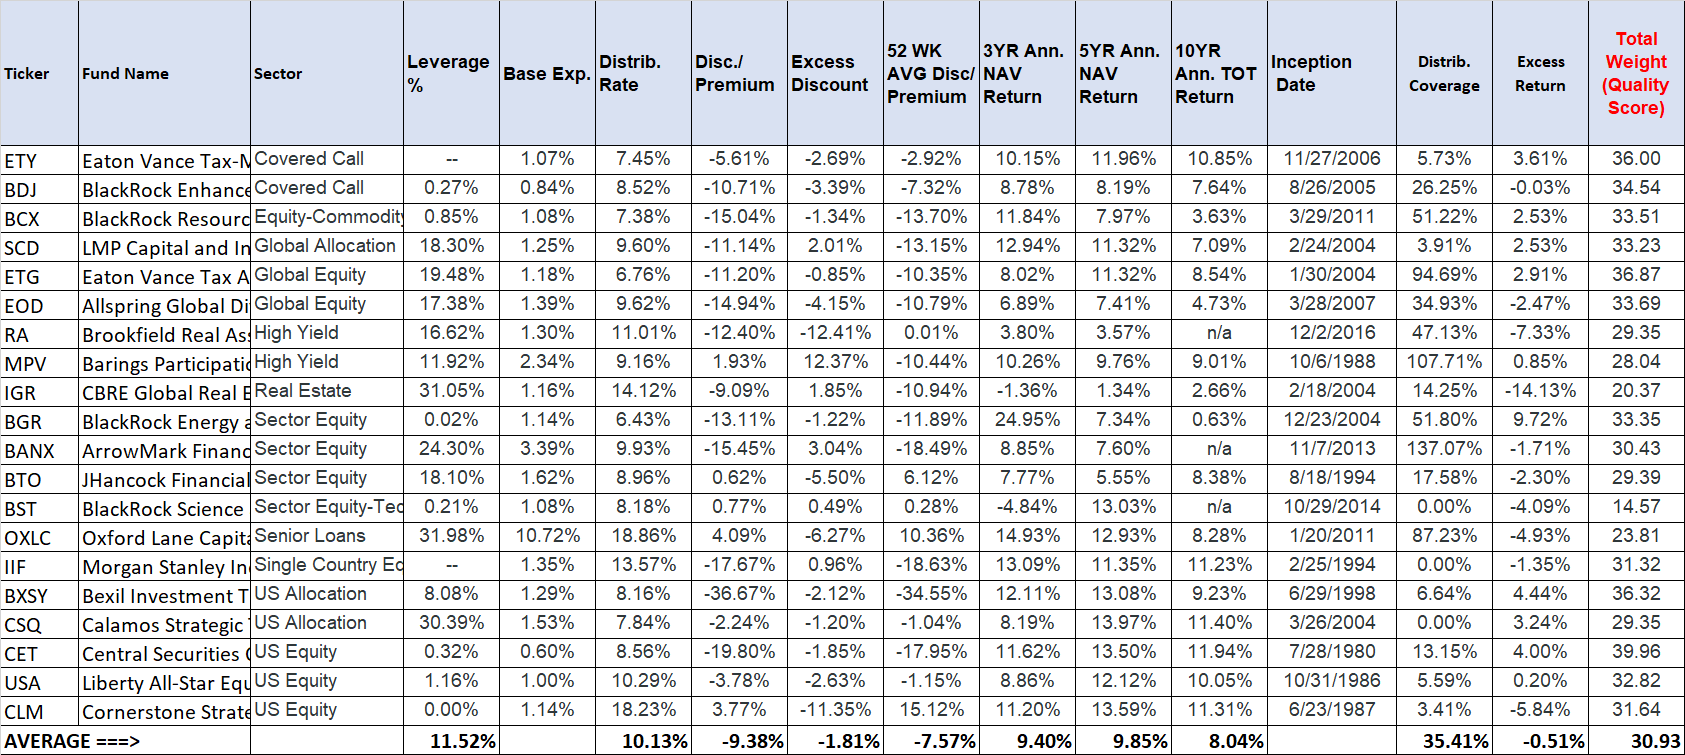
From here on, we will have to perform some subjective judgment and narrow the list to 10 names. Here's the list of the top 10 selections this month (in order of Quality Score):
(CET), (OTCPK:BXSY), (ETY), (EOD), (BCX), (SCD), (USA), (BANX), (MPV), and (OXLC).
Table 8B:
Author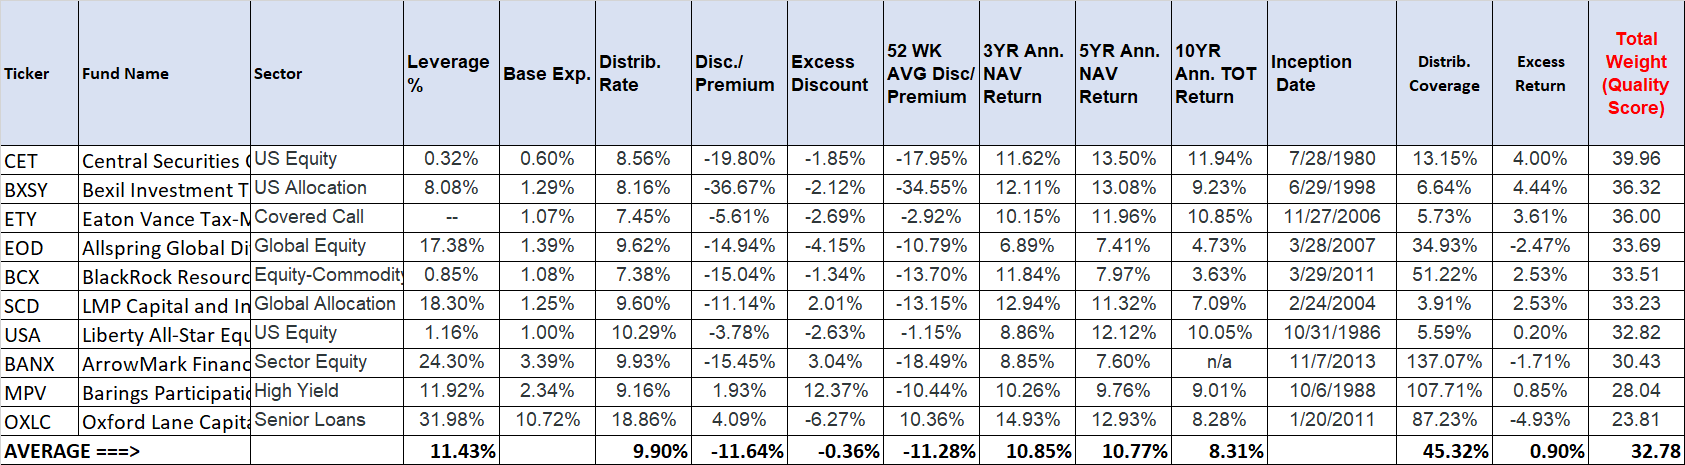
So far, we have followed our filtering criteria to a large extent. However, in the end, if we only want to select five funds, we will need to apply our subjective judgment. As such, for new CEF investors, our list of top 10 selections (table-8B) is quite compelling and makes a more diversified list. While we narrow down this list to five, we should be mindful to keep the list as diversified as possible in terms of asset classes. Since this step is mostly subjective, the choice would differ from person to person. Nonetheless, here are the selections for this month, based on our perspective (in order of Quality Score):
(BXSY), (SCD), (USA), (BANX), and (MPV).
Table: The Final 5 Funds:
Table 9:
(BXSY), (SCD), (USA), (BANX), and (MPV).
Author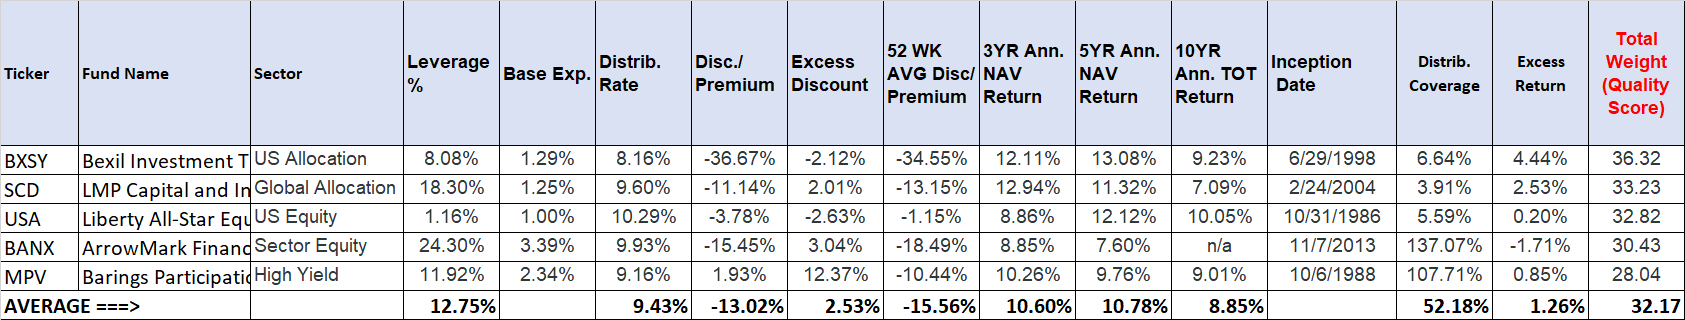
Some information about the selections:
Image-1:
BXSY's Fact sheet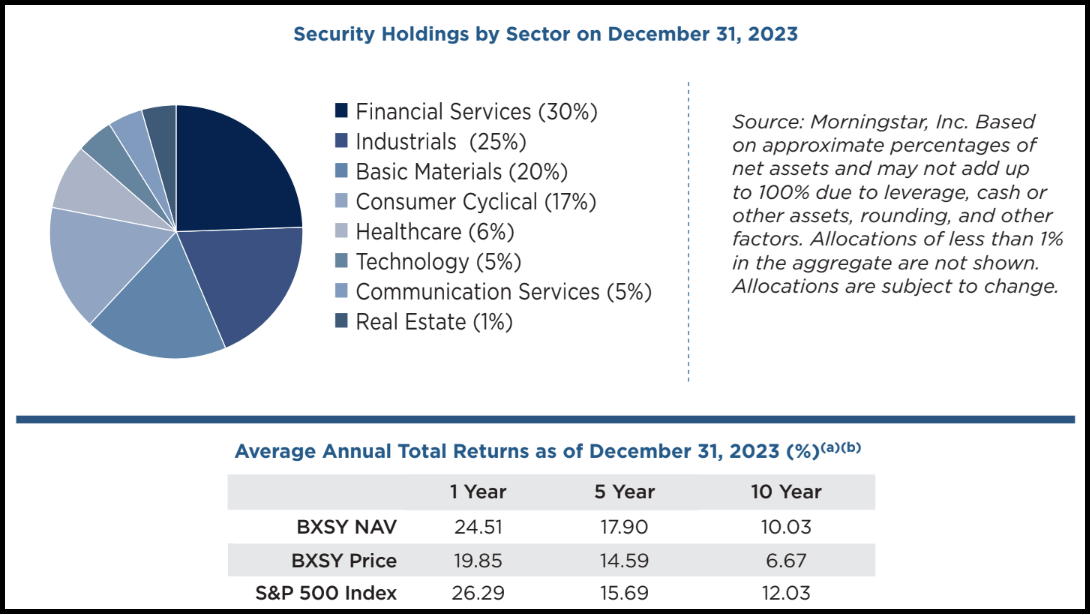
The best point in favor of this fund right now is that you are getting the equity assets at 65 cents for a dollar and getting 8% plus distribution. As the recent performance has shown some promise of good management, the discount may start closing to some extent. So, buying at this point may lead to some decent capital appreciation. Obviously, there is no guarantee, so one should be content with 8-10% total returns from this fund. Above all, this is a small fund with low trading volumes, so please perform due diligence and use caution.
It goes without saying that CEFs generally have some additional risks. This section is specifically relevant for investors who are new to CEF investing, but in general, all CEF investors should be aware of it.
They generally use some amount of leverage, which adds to the risk. The leverage can be hugely beneficial in good times but detrimental during tough times. The leverage also causes higher fees because of the interest expense in addition to the baseline expense. In the tables above, we have used the baseline expense only. If a fund is using significant leverage, we want to ensure that the leverage is used effectively by the management team - the best way to know this is to look at the long-term returns on the NAV. NAV is the "net asset value" of the fund after counting all expenses and after paying the distributions. So, if a fund pays high distributions and maintains or grows its NAV over time, it should bode well for its investors.
Due to leverage, the market prices of CEFs can be more volatile, as they can go from premium to discount pricing (and vice versa) relatively quickly. Especially during corrections, the market prices can drop much faster than the NAV (the underlying assets). Investors who do not have an appetite for higher volatility should generally stay away from CEFs or at least avoid the leveraged CEFs.
CEFs have market prices that differ from their NAVs (net asset values). They can trade either at discounts or at premiums to their NAVs. Generally, we should avoid paying any significant premiums over the NAV prices unless there are some compelling reasons.
Another risk factor may come from asset concentration risk. Many funds may hold similar underlying assets. However, this is easy to mitigate by diversifying into different types of CEFs ranging from equity, equity-covered calls, preferred stocks, mortgage bonds, government and corporate bonds, energy MLPs, utilities, and municipal income.
We use our screening process to highlight five likely best closed-end funds for investment each month. At the same time, we also provide a larger list of ten CEFs from many different asset classes. Our filtering process demands that our selections have an above-average long-term performance record, offer an average of roughly 8% distributions, and are relatively cheaper with reasonable discounts.
Please note that these selections are based on our proprietary rating system and are dynamic in nature. So, they can change from month to month (or even week to week). At the same time, some funds can repeat from one month to the next if they remain attractive over an extended period. Also, note that if a fund has not made it to our list, it does not mean it is not good. It could be because they may not be attractively priced at this time or trading at a premium while running our filtering process.
The selected five CEFs this month, as a group, are offering an average distribution rate of nearly 9.43% (as of 02/16/2024). Besides excellent distributions, these five funds have a proven past record over the short and the long term and collectively returned 10.60%, 10.78%, and 8.85% in the last three, five, and ten years. The leverage for the group, on average, is reasonable, at 12.5%. The current average discount (to NAV) is also very attractive, roughly at -13%. Since this is a monthly series, some selections may overlap from month to month.
Editor's Note: This article discusses one or more securities that do not trade on a major U.S. exchange. Please be aware of the risks associated with these stocks.