
designer491
designer491
This article series aims at evaluating ETFs (exchange-traded funds) regarding past performance and portfolio metrics. Reviews with updated data are posted when necessary.
SPDR® Bloomberg Convertible Securities ETF (NYSEARCA:CWB) started investing operations on 4/14/2009 and tracks the Bloomberg Barclays US Convertible Liquid Bond Index since. It has 283 holdings, an expense ratio of 0.40% and a 12-month distribution yield of 1.96%. Distributions are paid monthly.
As described in the prospectus,
“the Index is designed to represent the market of U.S. convertible securities, such as convertible bonds and convertible preferred stock. Convertible bonds are bonds that can be exchanged, at the option of the holder or issuer, for a specific number of shares of the issuer’s equity securities. Convertible preferred stock is preferred stock that includes an option for the holder to convert to common stock.”
Optionality allows companies to borrow money at a lower rate, and possibly avoid paying the principal, should the bond be converted. In this case, the principal is paid by common shareholders in dilution. Optionality is also attractive for lenders willing to mix fixed income and speculation on share price. As hybrid asset, its behavior is part equity, part fixed income. Due to embedded optionality, CWB may be classified by some brokers as a derivative product. In this case, buying it may require some adjustments in trading permissions.
Eligible securities must be U.S. dollar denominated and have:
There is no condition on the issuer's credit rating. The index is rebalanced once a month. During the most recent fiscal year, the portfolio turnover rate was 7%.
As of writing, 81.4% of the fund’s asset value is issued by companies with no credit rating. The portfolio has an average coupon of 1.91% and an average maturity of 3.4 years.
Maturity profile (Chart: author; data: SSGA)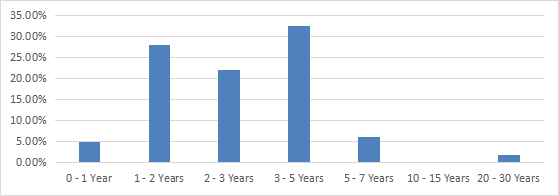
The next table lists the top 10 issuers, representing 17.3% of asset value. Each issuer may have several bonds in the portfolio (aggregate weights below are calculated by myself). The top name weighs 2.15%, so risks related to individual companies are low.
Name (Ticker) | Weight % |
WELLS FARGO & Co (WFC) | 2.15 |
MICROSTRATEGY INC (MSTR) | 2.01 |
PALO ALTO NETWORKS (PANW) | 1.94 |
LIBERTY MEDIA CORP | 1.84 |
BANK OF AMERICA CORP (BAC) | 1.73 |
AKAMAI TECHNOLOGIES INC (AKAM) | 1.72 |
WAYFAIR INC (W) | 1.58 |
UBER TECHNOLOGIES INC (UBER) | 1.54 |
DISH NETWORK CORP | 1.42 |
ROYAL CARIBBEAN CRUISES (RCL) | 1.38 |
Due to its characteristics of hybrid asset, CWB behavior is closer to a stock index than a bond index. Since inception, it has correlation coefficients of 0.83 with the S&P 500 Index (SP500), 0.69 with high yield bonds (HYG), and only 0.25 with a broad corporate bond index (LQD). Its correlation with Treasury bonds (calculated with various ETFs from 1-year to 20+ year maturity) is between 0 and -0.2, meaning no correlation at all. These numbers are an indication that convertible bonds are mostly driven by the common stocks of their issuers, not by the gap between coupon rates and treasury yields.
CWB has lagged the stock benchmark by 5% in annualized total return and shows similar risk metrics (drawdown and volatility).
Total Return | Annual Return | Drawdown | Sharpe ratio | Volatility | |
CWB | 320.54% | 10.11% | -32.06% | 0.73 | 12.97% |
SPY | 713.74% | 15.09% | -33.72% | 0.84 | 17.01% |
Data calculated with Portfolio123.
The next chart plots total returns of CWB and its two largest competitors, iShares Convertible Bond ETF (ICVT) and First Trust SSI Strategic Convertible Securities ETF (FCVT). The starting date is 11/04/2015 to match historical data availability. ICVT is leading by a short margin.
CWB vs. competitors (Seeking Alpha)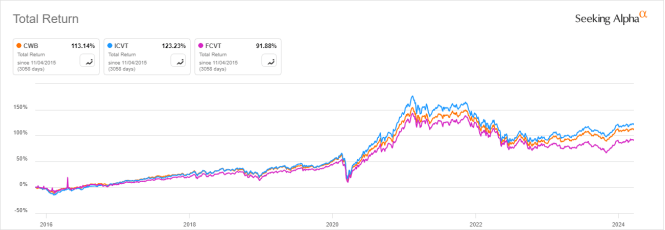
Bond-like returns and stock-like risks make CWB quite unattractive as a long-term investment. However, it may be a great instrument for tactical allocation purposes. Tactical allocation strategies consist of over-weighting assets with the highest probability of future gains. This probability is often arbitrarily measured by past performance. Countless variants are possible depending on the performance metric, weight calculation, look-back period, decision frequency, asset list and number of positions. The next table tracks a strategy with only two ETFs: CWB and the iShares 7-10 Year Treasury Bond ETF (IEF). Every week, it goes long 100% in the ETF with the highest 3-month return, or in cash if both have their prices below the 200-day simple moving average. This CWB-IEF rotational model is compared to both ETFs and to a total bond market ETF (BND).
since CWB inception | Total Return | Annual Return | Drawdown | Sharpe ratio | Volatility |
CWB-IEF rotation | 89.53% | 4.38% | -10.81% | 0.77 | 4.62% |
BND | 41.12% | 2.34% | -18.58% | 0.35 | 4.72% |
CWB | 112.51% | 5.18% | -17.08% | 0.67 | 6.62% |
IEF | 34.92% | 2.03% | -23.93% | 0.22 | 6.67% |
Calculations with Portfolio123.
The rotation beats the total bond market in return and shows a lower risk in drawdown and volatility. It has a better risk-adjusted return (Sharpe ratio) than both its components. A cautionary note: past performance is not a guarantee of future returns.
SPDR® Bloomberg Convertible Securities ETF holds a portfolio of convertible securities and is well-diversified in a number of companies. Most issuers have no credit rating. Due to the optionality of conversion to common stocks, this asset category has a stronger correlation with stocks.
SPDR® Bloomberg Convertible Securities ETF had an exceptional performance in 2020 due to its concentration in high momentum companies. Performance from 2009 to 2019 and since 2021 have been much less attractive. CWB correlation to stocks may boost the performance of a bond ETF portfolio in a bull market. It may also be used in a tactical allocation strategy with other bond ETFs. The CWB-IEF rotation presented in this post is a simple example. My Bond Rotation model, which is more sophisticated, is currently long in CWB and another bond ETF.