BHP Group is viewed as a dividend play with a strong balance sheet and potential for capital upside.
BHP stock may be nearing an important low and could be ready to move higher.
Price levels are determined using a scientific and mathematical methodology based on the structure of price.
lindsay_imagery
By Levi at Elliott Wave Trader; Produced with Avi Gilburt
Let's see. A 5% dividend bolstered by a strapping balance sheet along with the potential for capital upside. We're talking about BHP Group (NYSE:BHP). Yep, that one that was founded in 1851 and headquartered in Melbourne, Australia. First, we're going to get Lyn Alden's fundamental snapshot view. Then, we will look at how human behavioral patterns are shaping the structure of price on the stock's chart.
A Recent Capture Of Lyn's Views
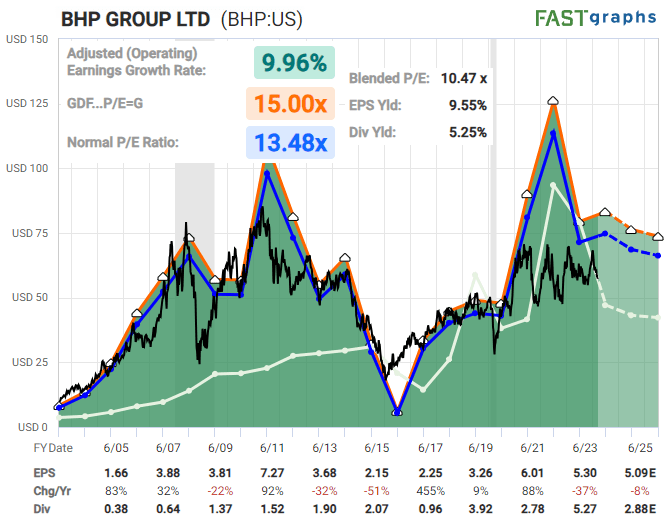
Lyn Alden covers a multitude of stocks for us and our members. Her cognizance is timely and insightful. Our recent query regarding BHP Group brought forth the following comments:
I view BHP as mainly a dividend play at this time. The balance sheet is strong, and the stock can serve as a useful source of income.
chart by Lyn Alden - FastGraphs
The upside is that should there be another commodity price breakout and a second wave of inflation, BHP can potentially serve as a hedge against that. So from a fundamentals perspective, I think it's best viewed as a positive-carry hedge against the prospect for another commodity/inflation wave in the years ahead." - Lyn Alden
With this in mind, let's now weave it together with the structure of price as shown on the chart for BHP. One quick note: we will share the 'native' chart for the symbol traded on the ASX exchange in Australia and also the symbol traded here on the NYSE.
The Structure Of The Stock Price Speaks Volumes
Just a brief point to crystallize what we're talking about here. Those who follow our work as presented to the readership know that we use sentiment, or human behavior, to measure and project what is likely next for a specific stock or a stock index. It is this structure that displays self-similarity at all degrees of the chart. As well, these forms will repeat since the markets are fractal in nature.
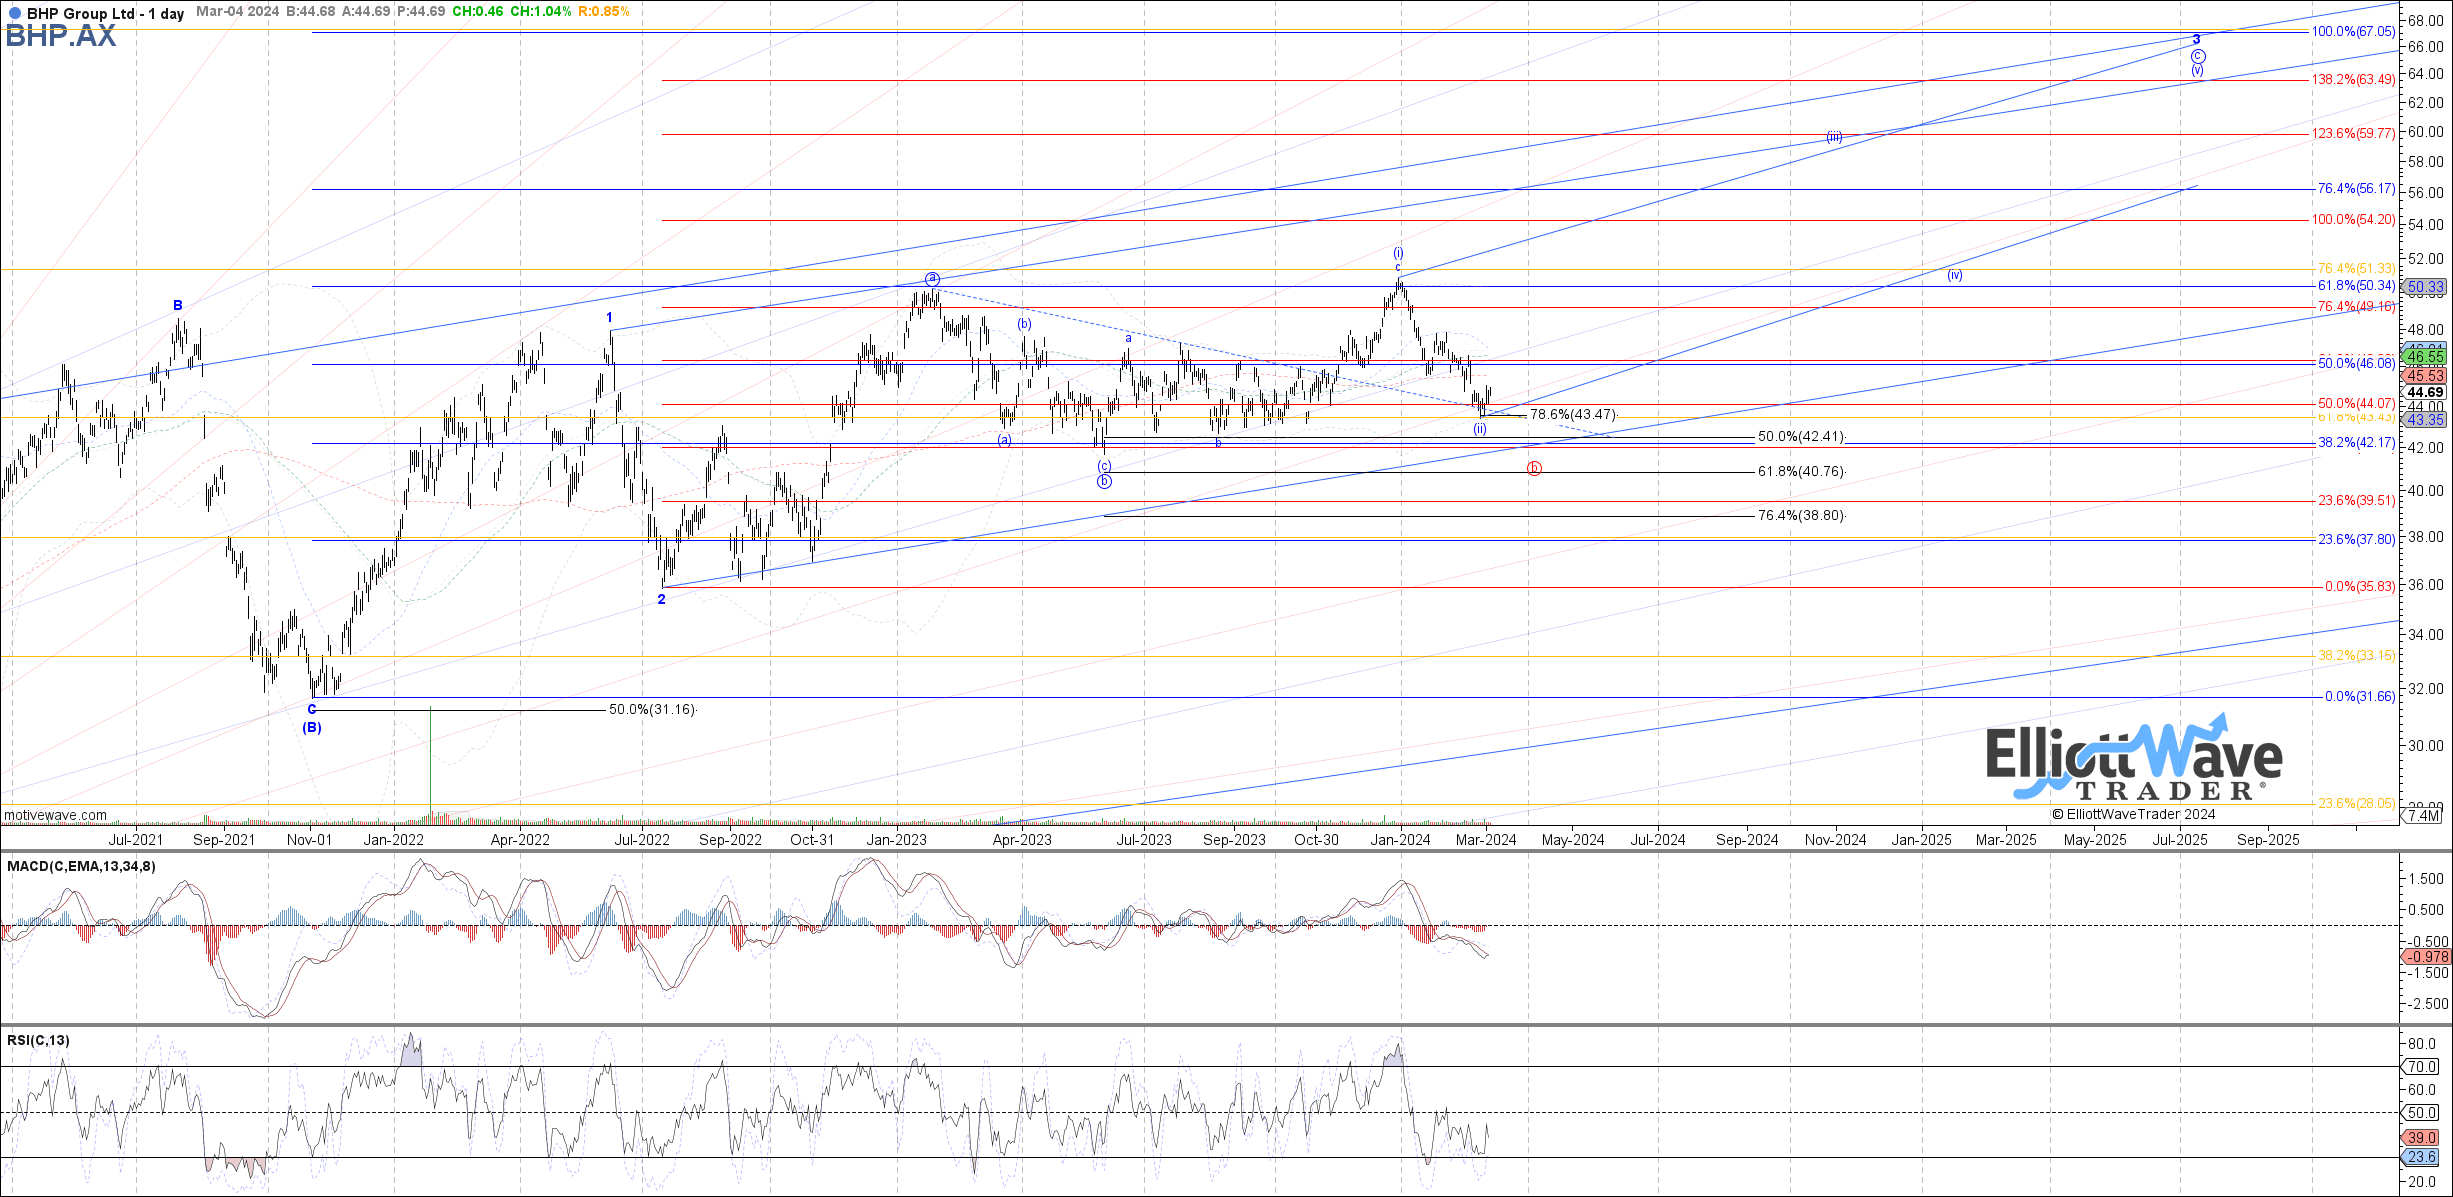
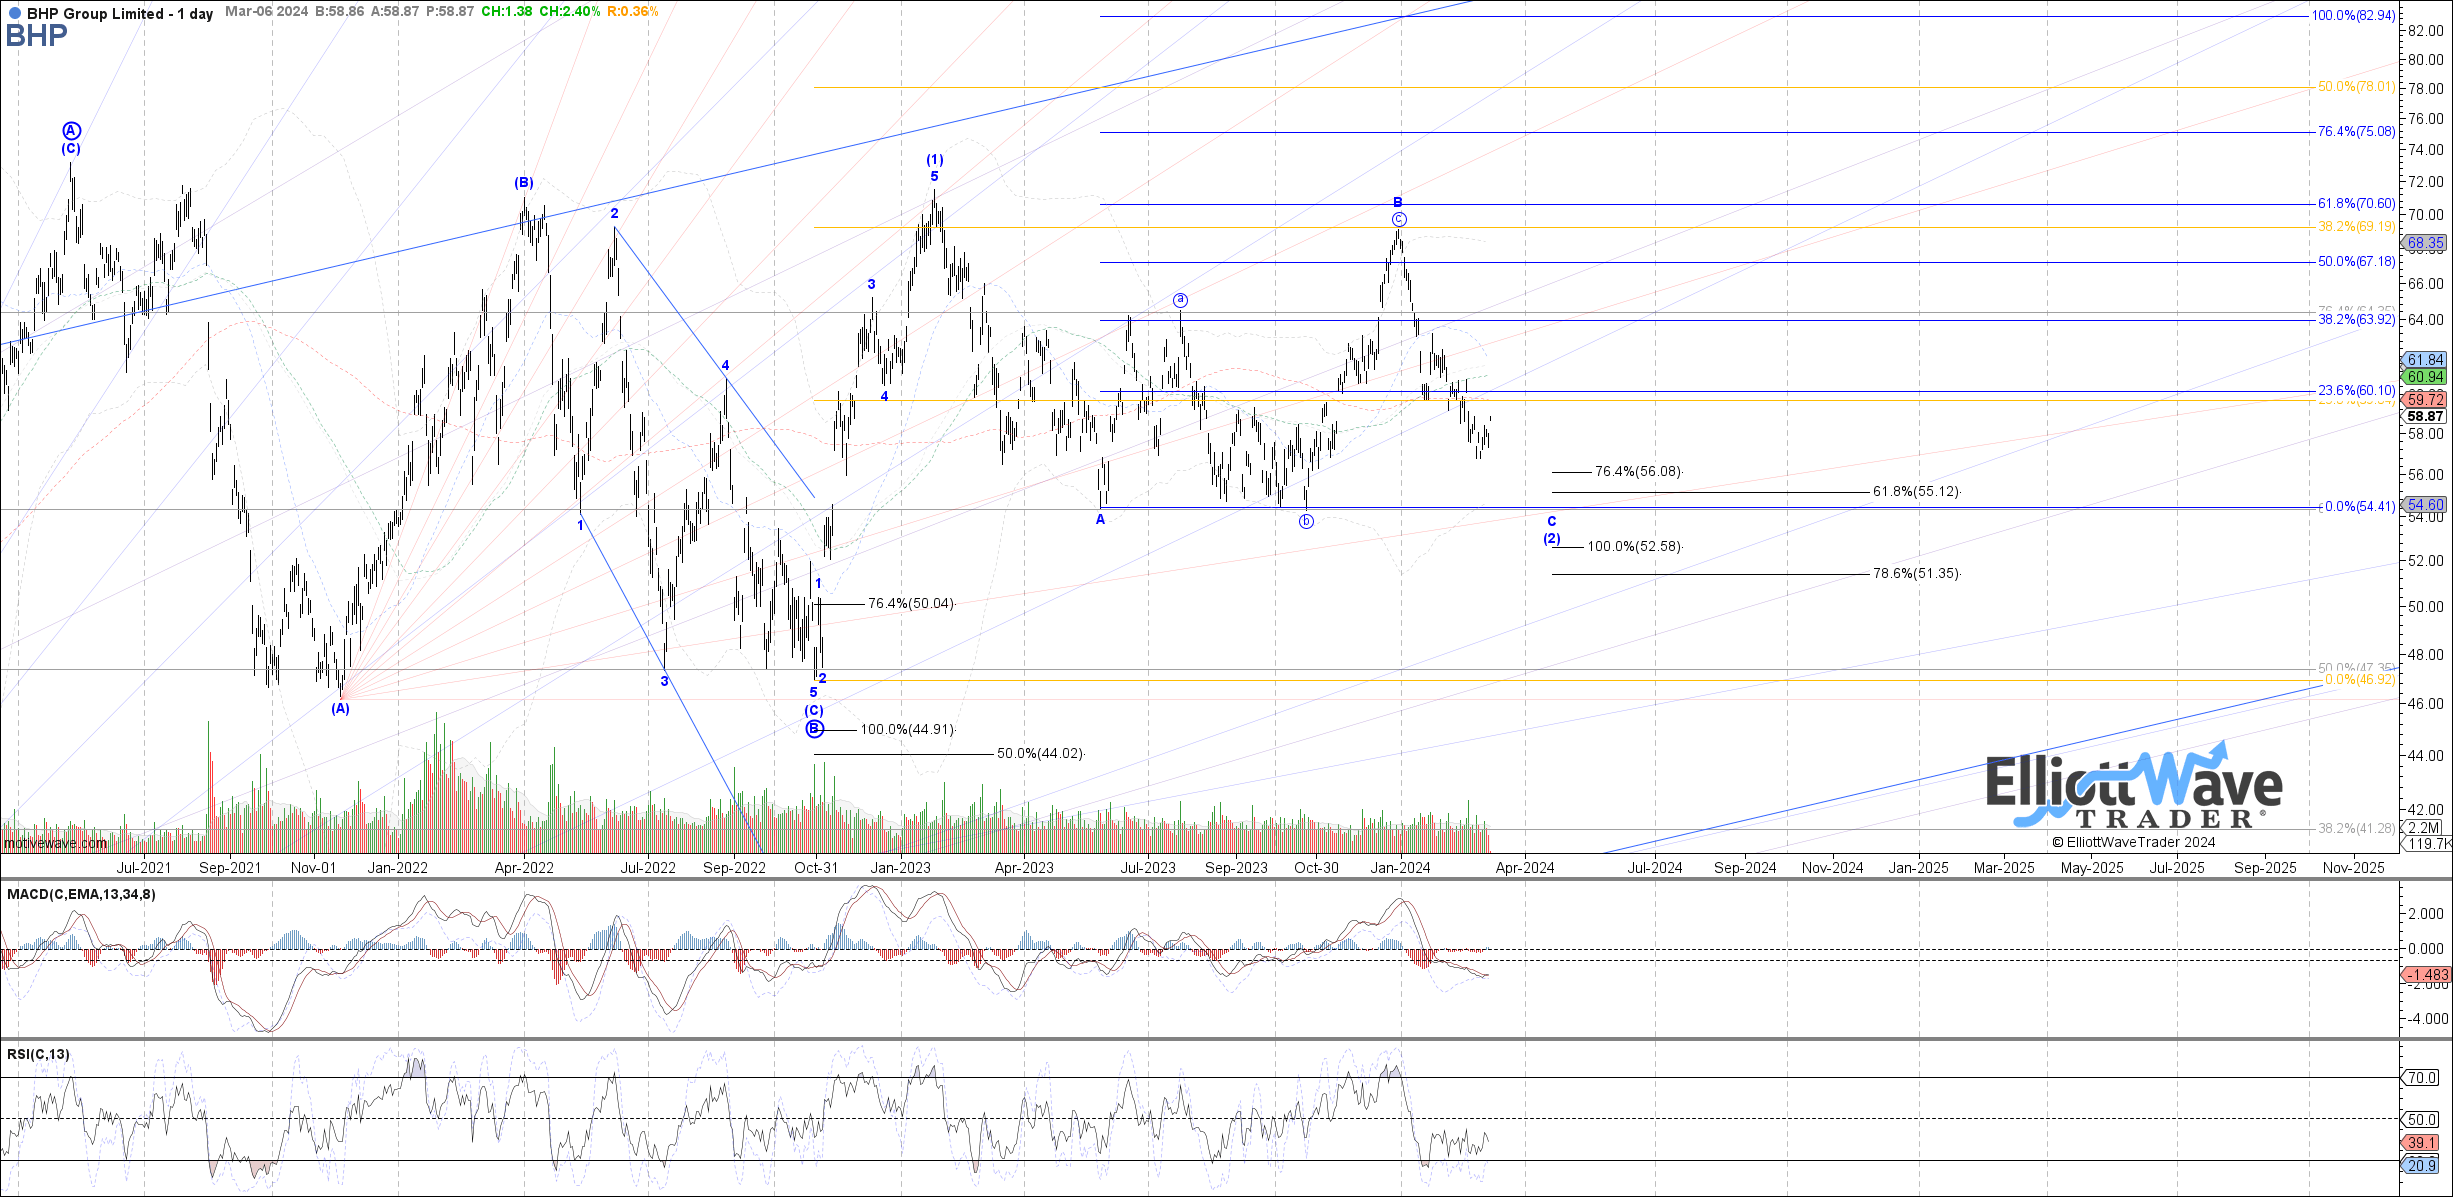
If we look at the charts for BHP, whether based on the ASX or NYSE, they are both telling the same story. The stock may be nearing an important low and could be readying to move higher.
chart by Garrett Patten - World Market Waves - Elliott Wave Trader
chart by Garrett Patten - World Market Waves - Elliott Wave Trader
Our lead analyst in World Markets is Garrett Patten. BHP is one of the 30 stocks that he covers in our weekly video. This is a ticker that we have had our eye on for a potential swing low to form. Looking at the charts shared above, you can see that the price is nearing important support.
If the near-term bullish scenario is to play out, the price should find a low in the $40-42 zone (via the ASX chart) and turn up in a rally that could carry the stock to as high as $63 next. Note that Garrett was giving this the chance to hold a wave circle 'ii' in the blue path. But the red 'b' path appears to have taken precedence here. This gives us an advantage, though.
The structure would now suggest that the price should move up in what would be a wave circle 'c' of the larger wave 3. 'C' waves are typically composed of 5 smaller waves. And, the initial wave up should also be 5 waves followed by a corrective pullback. Should this structure present itself in the next few sessions, then it would show us a higher probability and lower risk entry point to possibly ride the stock up in that anticipated wave 'c' of 3 illustrated on the chart.
(If using the BHP symbol listed on the NYSE, the structure is similar and a low near $52-55 would be equivalent to what is shown on the ASX index listed symbol)
Risks here would be a sustained move under 40 AUD or 52 USD. However, for as long as above these near-term support levels, we will look for a turn higher.
How Do You Come Up With These Price Levels?
While opinions may vary about how we arrive at these price levels, I can comfortably tell you that it is actually based on science and mathematics. In fact, Avi Gilburt has written many articles on this very subject, and they are available for your review. One suggestion would be to peruse this one. It's part one of a six-part series that fully reveals our preferred methodology for analyzing individual stocks and market indexes.
The following is one of the more thought-provoking studies provided in the entire body of research shared:
In a paper entitled "Large Financial Crashes," published in 1997 in Physica A., a publication of the European Physical Society, the authors, within their conclusions, present a nice summation for the overall herding phenomena within financial markets:
Stock markets are fascinating structures with analogies to what is arguably the most complex dynamical system found in natural sciences, i.e., the human mind. Instead of the usual interpretation of the Efficient Market Hypothesis in which traders extract and incorporate consciously (by their action) all information contained in market prices, we propose that the market as a whole can exhibit an "emergent" behavior not shared by any of its constituents. In other words, we have in mind the process of the emergence of intelligent behavior at a macroscopic scale that individuals at the microscopic scales have no idea of. This process has been discussed in biology for instance in the animal populations such as ant colonies or in connection with the emergence of consciousness.
As Elliott stated:
The causes of these cyclical changes seem clearly to have their origin in the immutable natural law that governs all things, including the various moods of human behavior. Causes, therefore, tend to become relatively unimportant in the long term progress of the cycle. This fundamental law cannot be subverted or set aside by statutes or restrictions. Current news and political developments are of only incidental importance, soon forgotten; their presumed influence on market trends is not as weighty as is commonly believed."
Listen To The Structure Of Price
It is this structure that helps us identify high-probability setups. It is also this very structure that tells us when we should shift our weight when to turn cautious, and conversely more bullish. This structure can communicate when we are wrong and therefore should modify our stance.
I would like to take this opportunity to remind you that we provide our perspective by ranking probabilistic market movements based on the structure of the market price action. If we maintain a certain primary perspective as to how the market will move next, and the market breaks that pattern, it clearly tells us that we were wrong in our initial assessment. But here's the most important part of the analysis: We also provide you with an alternative perspective at the same time we provide you with our primary expectation, and let you know when to adopt that alternative perspective before it happens.
There are many ways to analyze and track stocks and the market they form. Some are more consistent than others. For us, this method has proved the most reliable and keeps us on the right side of the trade much more often than not. Nothing is perfect in this world, but for those looking to open their eyes to a new universe of trading and investing, why not consider studying this further? It may just be one of the most illuminating projects you undertake.
(Housekeeping Matters)
If you would like notifications as to when our new articles are published, please hit the button at the bottom of the page to "Follow" us.