SOPA Images/LightRocket via Getty Images
SOPA Images/LightRocket via Getty Images![]()
Bright Horizons Family Solutions (NYSE:BFAM) has been in operation for 35 years, and it specializes in providing care and education services for working families. It is one of the leading providers of quality early education, childcare, and family care services. The services BFAM offers are mainly offered through multiyear contracts with employers, which offer such services as part of their employment benefit package to their employees. Some of the aims of such a benefit package are to improve their talent acquisition and recruitment processes, employee retention, and productivity.
Currently, BFAM is the largest provider of employer-sponsored childcare services. Its business can be segmented into full-service center-based childcare, backup care, educational advisory and other services, with full-service center-based childcare forming the largest share. BFAM is unique from other competitors as its business model focuses on multiyear contracts with employers.
BFAM’s historical financial performance has shown strong recovery and growth from the impact of COVID-19. Although margins have been expanding, they have yet to reach pre-pandemic levels. For FY2023, BFAM continued to report strong revenue growth, which grew at double-digit rate, while adjusted margins remained robust and were in line with 2022. Looking ahead, demand for childcare services is expected to remain robust as the number of women joining the full-time workforce and dual-income families increases. However, with a modest upside potential that lacks sufficient margin of safety, I am recommending a hold rating.
Over the past four years, BFAM’s revenue growth has been strong, except for 2020. In 2020, its full-service center-based child care segment’s revenue fell 39%. It was driven by the closure of its centers due to the COVID-19 pandemic. However, from 2021 onwards, revenue growth has recovered and has been growing at double-digit rates as COVID-19 subsides, leading to an increase in enrollment and the re-opening of temporarily closed centers.
Author's Chart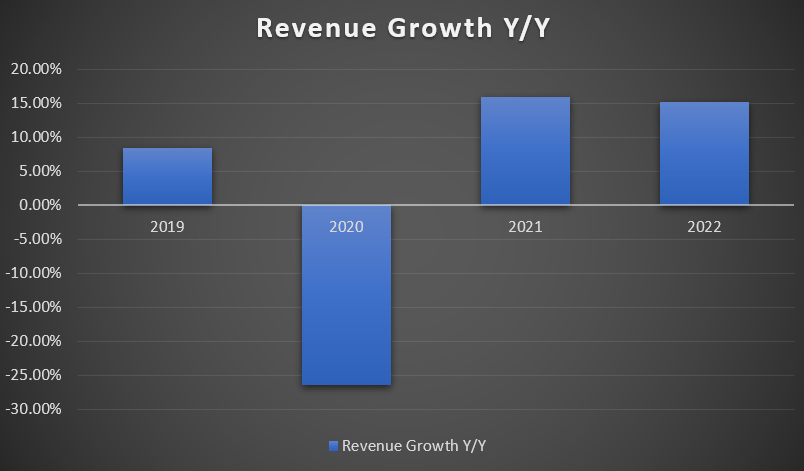
Moving onto margins, it's clear that 2020 took a big hit due to the COVID-19 pandemic. 2020’s gross profit margin decreased year-over-year when compared to 2019. The decrease was driven by reduced gross profit margins under its full-service center-based child care segment, which forms the largest share of total revenue, due to the impact of COVID-19. As a result, 2020’s net income margin was impacted and fell year-over-year. From 2021, margins have started to recover, but they are still not back to pre-pandemic levels in 2019. In 2019, SG&A as a percentage of revenue was 10.7%, but in 2022, it was 14.3%, resulting in a lower net income margin. The increase in SG&A was driven by its continued effort to ramp up business and overhead related to the acquired Only About Children [OAC] operations.
Author's Chart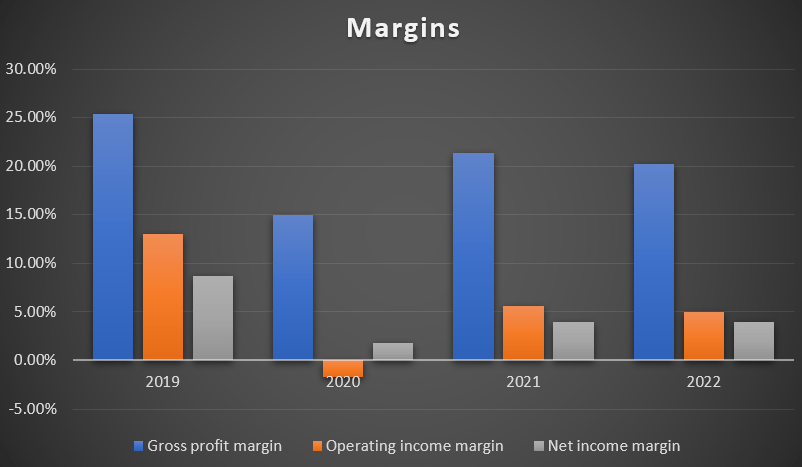
Author's Chart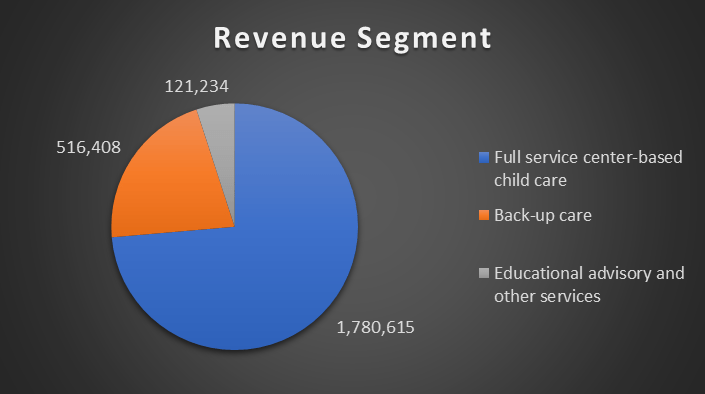
BFAM services are curated to assist the workforce in tackling the challenges of parenthood in modern working life. Their services can be segmented into full-service center-based child care, backup care, educational advisory and other services. Full-service center-based child care forms the largest revenue, and it offers comprehensive service at centers situated near or an employer’s sponsored working site, as well as places within their community. Back-up care comes in second, providing family support services for dependents of all ages and coverage in times when regular care is unavailable.
For 4Q23, BFAM reported strong earnings results. Its revenue grew 16% year-over-year to $616 million, driven by strong enrollment gains, price increases, and increased utilization of its back-up care services. Moving down its P&L, 4Q23 income from operations fell 29% to ~$28 million. This decrease is caused by incremental impairment losses, which amounted to $21.8 million, and also a reduction in funding from government programs that are related to pandemic support. As a result of the decrease in income from operations, 4Q23’s net income fell 69% year-over-year to $5.5 million. Diluted EPS reported for 4Q23 was $0.09 vs. 4Q22’s $0.31.
However, on an adjusted basis, its profitability grew year-over-year across the board. 4Q23’s adjusted EBITDA grew 10% to ~$99.2 million, while adjusted income from operations increased 15%. The increase was driven by the strong financial performance of its full-service center-based child care and back-up care revenue segments. As a result, adjusted net income grew 9% to ~$48 million, and diluted adjusted EPS grew ~7.7% to $0.83.
For the full year, FY2023 reported revenue growth of 20%. On an adjusted basis, adjusted EBITDA was up 11% to $352 million, while adjusted net income also grew 8% to $164 million. FY2023 reported diluted adjusted EPS of $2.84, which is up 9% year-over-year. Based on the following chart, it is clear that BFAM’s 2023 margins are in line with 2022, and it isn’t showing any signs of margin contractions on an adjusted basis.
Author's Chart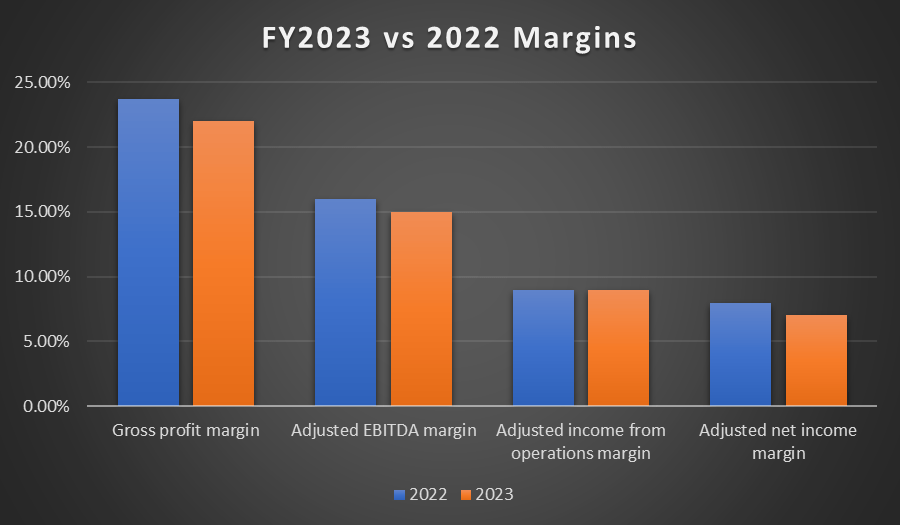
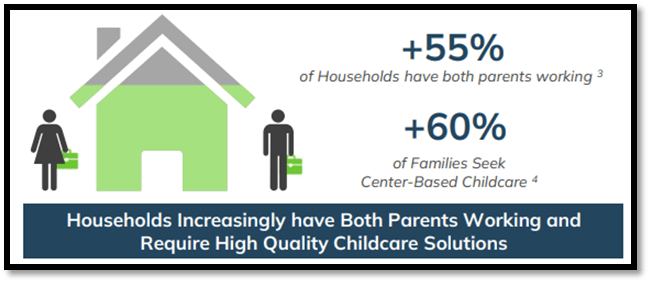
Based on the following chart, the number of women pursuing full-time jobs has been increasing. In the 1980s, it was estimated that there were about 25 million women in the workforce, but as of today, it has grown to ~69 million. Currently, women make up ~50% of the workforce. As more women enter the full-time workforce, it might potentially drive childcare service demand up as the need for it grows. In addition, approximately 55% of families are dual-income families, meaning both parents are working, and currently, ~60% of families are seeking childcare services. Therefore, these numbers show that the current demand for childcare services is strong. Moving ahead, as the number of dual-income families grows, it might also potentially drive demand for childcare services up.
Investors Relations Investors Relations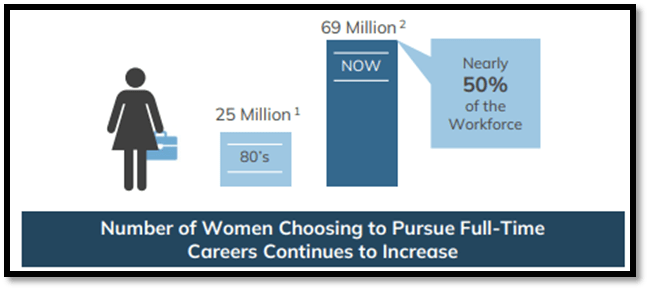
As the largest provider of employer-sponsored child care, BFAM has a strong and stable employer partnership. One of the main drivers of such a strong employer partnership is the ROI it produces for employer, as it improves employee retention, talent acquisition and recruitment, and work productivity. With such a strong partnership, it also benefits BFAM. With employer sponsorship, it helps to maintain high enrollment rates in BFAM's programs and encourages utilization of the services.
With growth, BFAM is able to invest in its staff, offering competitive compensation and professional development, which can improve service quality. As a result, it has a low turnover rate among staff. With better service quality, it encourages and entices other companies to partner with BFAM, and this essentially creates a positive feedback loop.
As there are no direct competitors that are listed, I will be using peers that operate in the education services industry, which BFAM operates in. Based on the following peers provided by Seeking Alpha, I will be comparing BFAM’s performance against theirs.
Seeking Alpha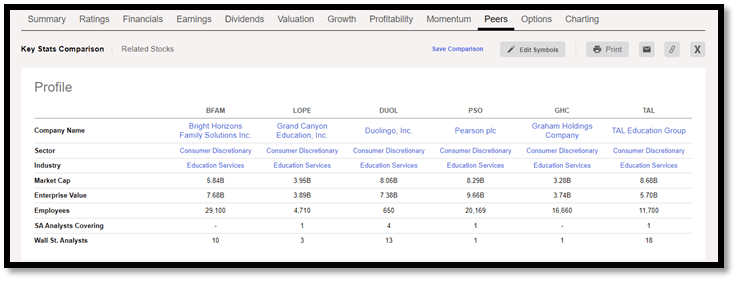
In terms of forward revenue growth, BFAM significantly outperformed its peers. BFAM’s forward revenue growth rate is 11.49%, while the peers’ median is 6.11%. In terms of profitability, BFAM’s gross profit margin TTM of 20.47% is lower than the peers’ median of 52.61%. However, despite a lower gross profit margin TTM, BFAM’s net income margin TTM of 3.72% is slightly higher than the peers’ median of 3.67%.
Currently, BFAM’s forward P/E of 30.65x is trading higher than the peers’ median of 17.12x. However, given its significant outperformance in forward revenue growth rate, slight outperformance in net income margin given lower gross profit margin TTM, and consistent EPS beats over the last few quarters, I argue that BFAM should be trading above its peers’ median P/E. In addition, BFAM’s current P/E ratio is significantly lower than its 5-year average of 60.05x, thus reducing the likelihood that it is currently overvalued.
Seeking Alpha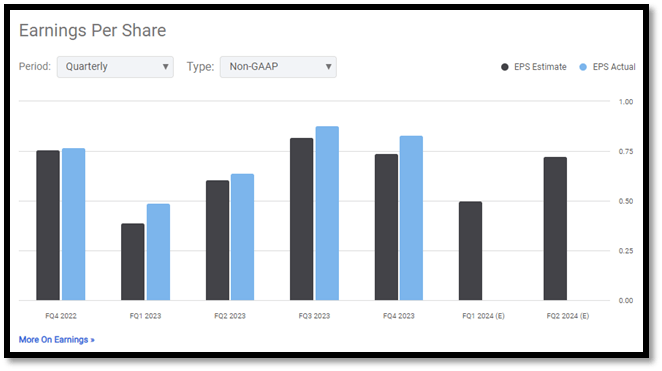
However, given that its current P/E ratio is 1.79x higher than the peers’ median, I will exercise caution when valuing BFAM given the significant P/E premium. In order to stay conservative, I will be applying a 10% discount to BFAM’s current forward P/E ratio so as to create a wider margin of safety, arriving at a forward P/E ratio of ~27.59x.
Author's Valuation Model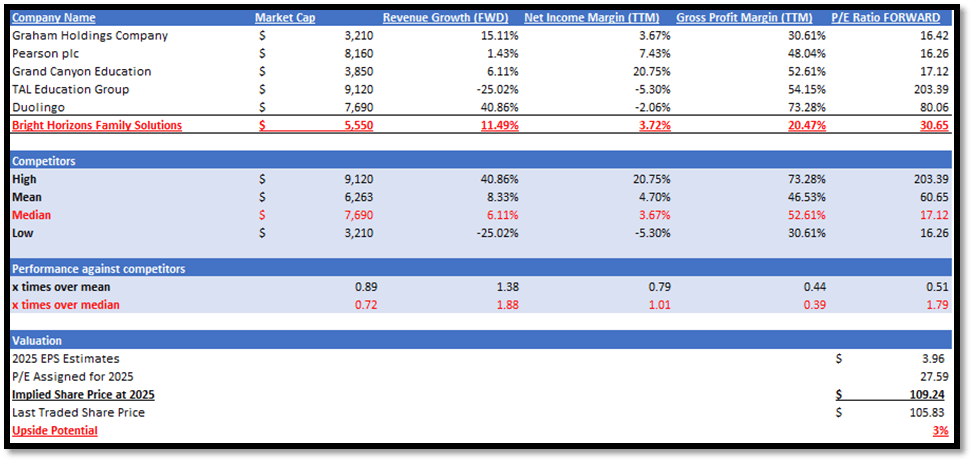
For the quarters ahead, I am expecting BFAM to continue growing. As more women pursue full-time careers, I believe the need for childcare services will also grow. Therefore, this is one of the drivers that will grow BFAM’s demand. In addition, more than 55% of families have both parents working, and more than 60% of families are seeking center-based childcare services. From these numbers, it is clear that there is a strong demand for childcare services, which positively impacts BFAM. Moving ahead, as the number of dual-income families increases, I anticipate it will drive demand higher. Therefore, in the following quarters, it is essential to monitor the total enrollment count and average tuition rate, which are reported by BFAM and provided in its 10-Q SEC filing, as these figures are a good indicator of childcare service demand.
For the 2024 outlook, management echoes the same sentiment. They are expecting 2024’s revenue to be between $2.6 and $2.7 billion. Compared to 2022, this represents a year-over-year growth rate of ~31% when using the midpoint of the guidance. Onto diluted adjusted EPS, management is expecting between $3 and $3.20. This represents a year-over-year growth rate of ~9.1%. Overall, the outlook for 2024 is positive, and management’s positive guidance shows that they are confident in the business’s outlook.
Seeking Alpha Seeking Alpha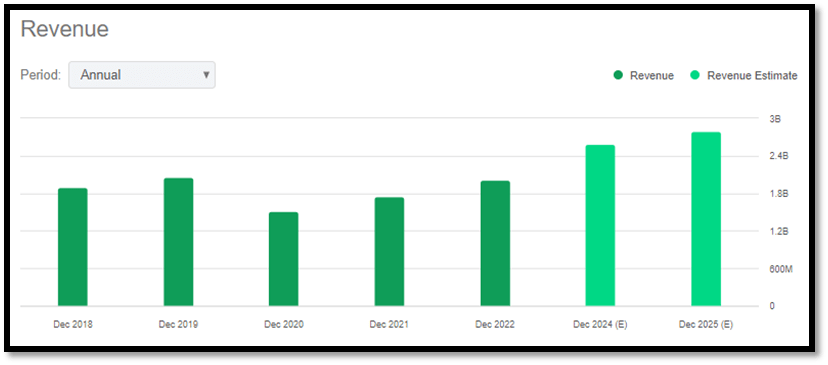
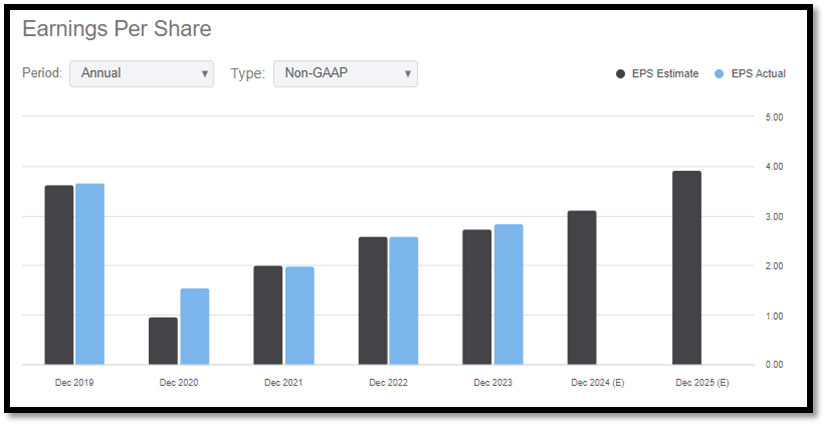
For 2024 and 2025, the market estimates for BFAM’s revenues are $2.65 billion and $2.89 billion, respectively. In addition, the market’s estimate for BFAM’s EPS in 2024 is $3.09 and $3.96 in 2025. Given the growth catalysts and strong financial performance discussed above, these estimates are justified. By applying ~27.59x to 2025 EPS estimates, my 2025 price target is ~$109, which represents a modest low single-digit upside potential and does not provide enough margin of safety.
Seeking Alpha
The upside risk is in relation to the growing demand for childcare and back-up care services as more women join the full-time workforce and dual-income families increase. As discussed above, these have been contributing positively to BFAM’s top and bottom lines. If BFAM was to report better than expected revenue or margins that beat market estimates for the upcoming quarter, especially if they outperform the peers’ median margin, the market might revise its valuation for BFAM upwards given its superior forward growth outlook. As a result, it might potentially cause its share price to appreciate.
In conclusion, BFAM’s past financials have demonstrated strong growth and recovery from the impact of COVID-19. Margins have been growing, but they have not recovered to pre-pandemic levels. BFAM’s revenue segment can be divided into three segments, with full-service, center-based child care forming the largest share. For FY2023, BFAM continued to report strong double-digit revenue growth while its adjusted margins remained robust, as they were in line with 2022’s margins.
Looking ahead, as more women seek full-time employment and the number of dual-income families increases, this is expected to bolster demand for childcare services. In addition, BFAM has a strong partnership with employers due to the ROI it creates for employers. This relationship between BFAM and employers is creating a positive feedback loop. However, given the modest upside potential, I am recommending a hold rating for BFAM as of now due to the lack of margin of safety.