
monsitj
monsitj
In this article, I will outline why I think Baxter International Inc. (NYSE:BAX) is a buy. BAX is a member of the health care industry and sells health care equipment. While not a factor in my analysis, BAX is expected to see double-digit earnings per share growth over the next three years, which is attractive. My technical analysis will focus on price action, momentum, volume, and relative strength using a weekly time frame. I will also mention the importance of risk management in this article, just like I did here and here. Let’s look at Chart 1 below.
Chart 1 – BAX Weekly with 30-Week Moving Average, Momentum, Volume, and Relative Strength
www.stockcharts.com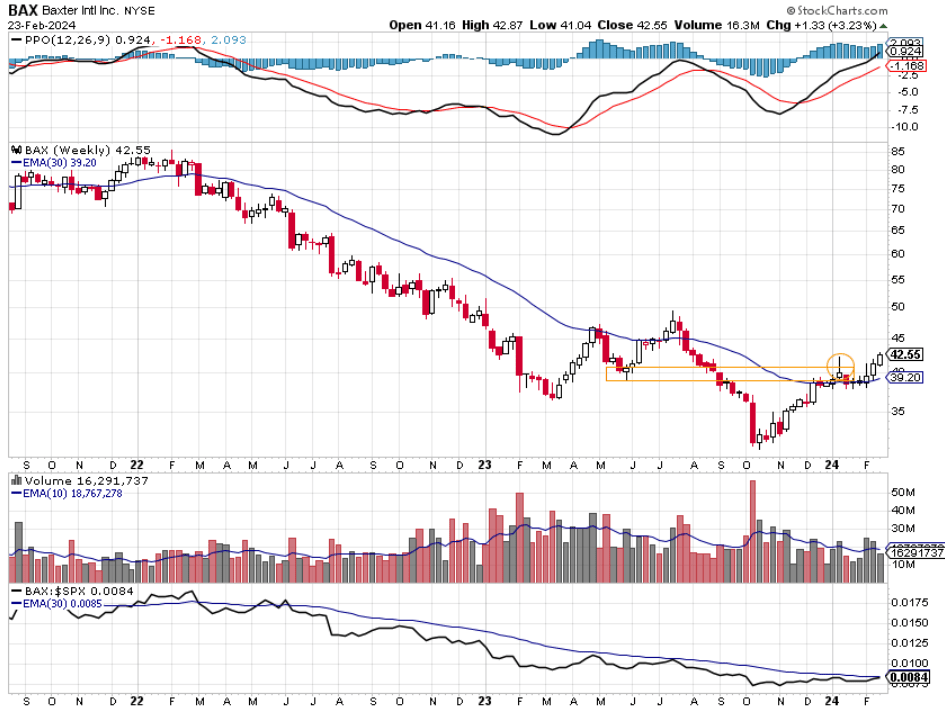
In February 2022 things were looking good for BAX shareholders as the stock reached $85 per share. However, in early 2022, things changed, and BAX started to decline. On Chart 1 you can see the 30-week exponential moving average (EMA) in blue. How price interacted with that 30-week EMA gave clues to whether BAX was consolidating its gains before another leg higher, or if BAX was ready to decline. I like to use the 30-week EMA as a guide to determine if the stock is moving higher or if it is in a downtrend. I prefer to own stocks that are above an upward trending 30-week EMA and be out of or short stocks that are below a downward trending 30-week EMA. That simple rule keeps me out of trouble and allows me to participate in major moves to the upside. Back to Chart 1. In March 2022, BAX closed below its 30-week EMA and then stayed below that EMA for the next 14 months. During that time, BAX lost over 50%. That’s what I meant by keeping me out of trouble. I wouldn’t have owned BAX once it closed below the 30-week EMA, and therefore would not have owned a stock that lost half its value. Once BAX bottomed in March 2023, it rallied back to its declining 30-week EMA but couldn’t stay above the EMA, telling an investor BAX is not a buy yet. BAX pulled back some and then put in a higher low in May 2023, meaning that the low in May at $39.05 was higher than the previous low in March 2023 at $36.63. I want to see stocks putting in higher lows along with higher highs. That is the definition of an uptrend. BAX rallied from the higher low in May 2023, and closed above the 30-week EMA and stayed there for a few weeks. That proved to be a false signal, as BAX then declined below the 30-week EMA and put in a new low in October 2023. That low of $30.76 represents a total decline of 64% from the February 2022 high of $85.62. An investor could have avoided much of that decline by simply not owning BAX when it was below the 30-week EMA. Now I think things are different with BAX. Since the low in October, BAX has rallied and did two bullish things. First it rallied back to the 30-week EMA and then consolidated around that EMA. Second, BAX has started to move higher, and the 30-week EMA has started to trend higher itself. I contend that BAX has put in a higher high and a higher low, although it is hard to detect. From the October low, BAX rallied to a high of $42.23 in January and then pulled back some, but not that much. That minor pull back to $ 37.87 is the higher low. Then BAX rallied to a new high, closing at $42.55. That tells me that BAX has put in a trend reversal and is now ready to rally. Price action of a higher high and higher low, along with the price being above a now upward trending 30-week EMA, is bullish to me.
Momentum is also something I pay attention to when I buy a stock, as I want to see bullish momentum. The top pane of Chart 1 shows the Percentage Price Oscillator (PPO) which measures momentum in two different ways. Short term bullish momentum is when the black PPO line is above the red signal line. That condition has been in place since November 2023. Long term bullish momentum is what I really want to see, and that can be found when the black PPO line is above the zero or centerline of the PPO chart. The reason I say that is the long-term indication is because you can see that crosses above or below the zero or centerline of the chart are not that common. The black PPO line stays above or below the zero or centerline of the chart for long periods of time, which correspond to long periods of bullish or bearish trends. Notice the decline from February 2022 to the low in October 2023. There was long term bearish momentum displayed by PPO. Now things have changed. The black PPO line is reading 0.924 which is long term bullish. I want to own stocks that have bullish momentum, and BAX has both short- and long-term bullish momentum.
Volume is the next aspect of my analysis. I want to own stocks that institutional money managers are buying. Since the low in October 2023, the biggest bars have been the black bars which show that volume accompanied a higher price for the week. In other words, institutional money managers were accumulating positions in BAX. The only reason they do that is because they think that BAX is undervalued at this price level. That might have something to do with that double-digit earnings per share growth anticipated for each of the next three years. Volume behavior is bullish in my opinion.
The bottom pane of Chart 1 shows BAX compared to the SP 500 index. I want to own stocks that are outperforming the SP 500. When the black line is trending higher, that tells us that BAX is outperforming the SP 500 index. When the black line is declining, that tells us that BAX is underperforming the SP 500 index. BAX underperformed the SP 500 index from February 2022 to its bottom in October 2023. Since then, BAX has slightly outperformed the SP 500 index. The relative strength of BAX to the SP 500 index is the least bullish element of my analysis, but it appears to be turner higher.
Whenever I buy a stock, I first think of when I would get out of the position to avoid a big loss. I recognize that my analysis could be incorrect, and I want to have a risk management plan in place to keep me out of trouble. The easy solution to that is to sell the position, or at least sell a part of the position if BAX finishes the week below the 30-week EMA. If you sell then, and the next week BAX closes back above the 30-week EMA, that is frustrating, but you can always buy back in on a close above the 30-week EMA, especially if PPO is long term bullish. The key is not to hold on to a losing position for any length of time. Remember that every 64% decline in a stock started with a 5%, 8%, 12% decline. Don’t hang on to losing positions.
In summary, BAX looks like a buy at this price. BAX is above a rising 30-week EMA and has put in a higher high and a higher low. Price action is bullish. BAX has both short-term and long-term bullish momentum. Volume indicates that institutional investors are accumulating shares, which is bullish. Relative strength is okay and maybe even getting better. Lastly, if you decide to buy BAX or if you own it already, have a risk management plan in place to avoid a large loss. It’s okay to be wrong when buying a stock. It’s not okay to stay wrong.