simonkr
simonkr
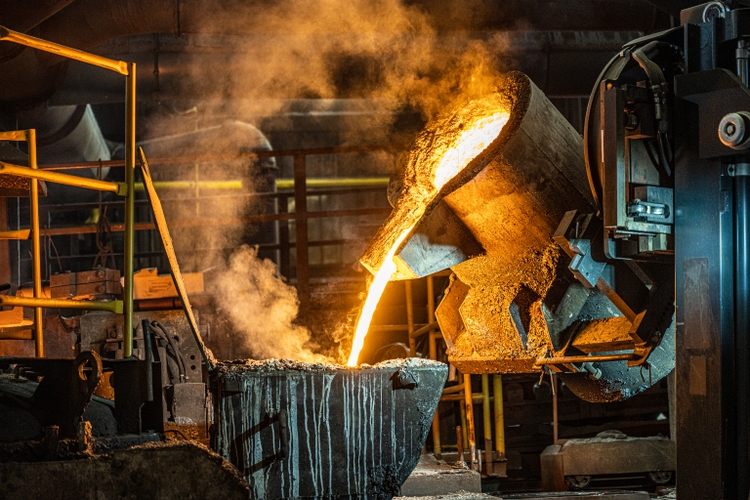
Algoma Steel Group (NASDAQ:ASTL) is a steel company that is transforming its Blast Furnace steel-making process into an EAF one. As steel is a cyclical commodity, this makes ASTL a cyclical company. However, ASTL was only formed in 2021.
As such, to get an estimate of its performance over the cycle, I look at the performance of its peers. The peers' performance also provided a basis to estimate how the margins would improve under the EAF process. Based on this, I found that there is a margin of safety to investing in ASTL.
The current form of ASTL came from the 2021 business combination with Legato, a special-purpose acquisition company. As such, looking at data before 2021 may not be comparing apples to apples.
ASTL is the parent company of its operating subsidiary Algoma Steel Inc. which was incorporated in 2016 to take over the assets and liabilities of a Canadian steel company that sought creditors' protection.
To make a long story short, ASTL is today an integrated steel producer that produces sheet and plate products that are sold primarily in Canada and the US. In FYE 2023,
Because of its short business history, looking at the 2022 or 2023 performances will not give you an accurate picture of its long-term business performance.
There are 2 reasons for this:
ASTL is a cyclical company. This is acknowledged by the company:
The steel market is a cyclical commodity business with significant volatility in prices in response to various factors, including market demand, supply chain inventory levels, and imports…" 2023 Form 40k.
Apart from being cyclical, there were extraordinary steel prices over the past few years, as illustrated in Chart 1.
Chart 1: Hot Roll Steel price trends (Trading Economics)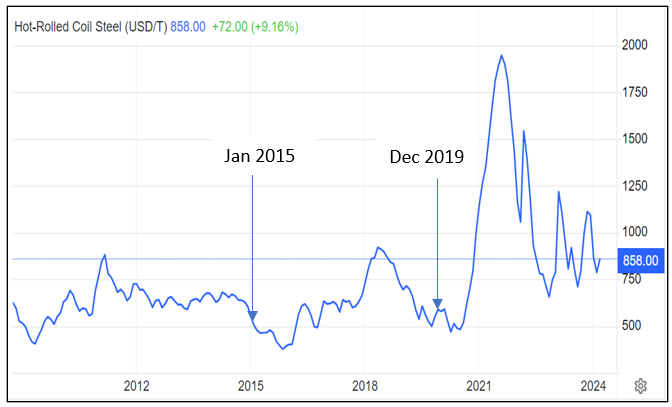
According to Professor Damodaran, because of the cyclical nature, extrapolating the current performance can lead to a misleading picture. The better approach is to look at the normalized performance over the cycle.
The challenge for ASTL is that it does not have a long enough operating history for this.
There are 2 main ways to make steel:
The company is currently using the Blast Furnace technology to make steel. However, in 2021 the company announced its plans to construct 2 EAFs to replace its existing Blast Furnace steelmaking operations. This transformation is now expected to be completed by the end of the calendar year 2024.
As the production cost using EAF is lower than that using Blast Furnace, you can imagine the impact on the bottom line.
ASTL had been profitable to post the business combination with return on capital of 79% and 17% for FYE 2022 and 2023 respectively. Based on the Dec 2023 LTM results, the FYE 2024 return on capital would be about 9%.
The declining returns, especially for FYE 2024, can be attributed to the decline in steel prices. As can be seen from Chart 1, the 2023 steel prices are not yet at the long-term historical average level.
Extrapolating from here, the returns would be below 9% when prices reach the long-term historical average. But this lower return has not taken into account the lower production cost when the EAF comes on stream.
I wanted to get a picture of how ASTL will perform through the cycle, as well as with the EAF in place.
To do this, I looked at the performance of other steel companies, covering those with Blast Furnace and EAF operations. Accordingly, I have selected the following panel companies for comparison.
While steel is a commodity, the above companies have different product mix and customer base. While we will not have a perfect apple-to-apple comparison, I hope that the trends can throw some light on how ASTL will perform in the future.
At the same time, the panel companies have different shipment volumes, as can be seen from Chart 2. To cater to this, I used ratios in all the comparisons.
Chart 2: Panel annual steel shipment (Author)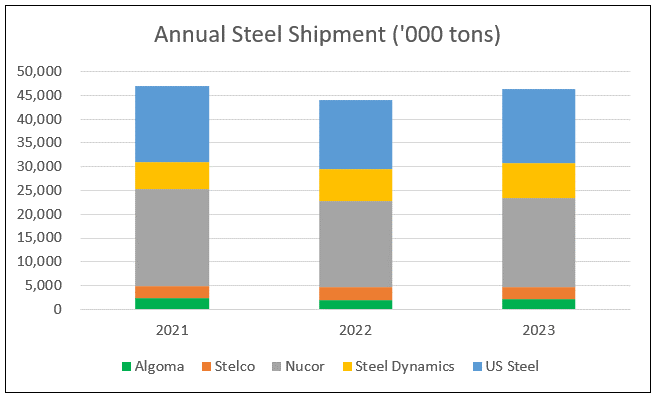
I looked at 2 groups of metrics to get a picture of the operating trends of the companies over the past 3 years.
Note that ASTL has March as the financial year-end, whereas all the others have December as the financial year-end. For a more meaningful comparison, I offset ASTL results.
For example, for the 2021 comparison, I used the Dec 2021 FYE results for the other companies. For ASTL, I used the March FYE 2022 results.
Chart 3: Gross Profit Margin and Contribution Margin (Author)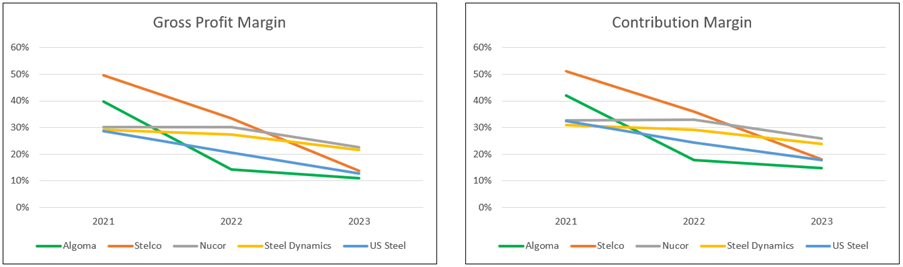
Notes to Contribution Margin. I broke down the operating profits into fixed costs and variable costs.
You can see declining trends for all companies under both metrics. You should not be surprised given the declining steel prices.
Tables 1 and 2 compare the average margins for 2 different periods:
Table 1: Gross Profit Margins (Author) Table 2: Contribution Margins (Author)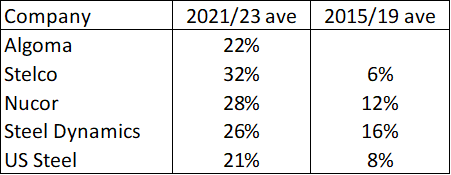
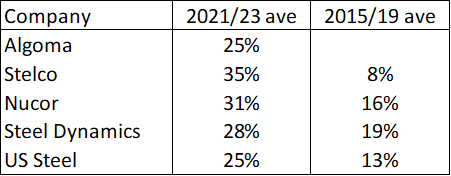
Nucor and Steel Dynamics are "pure" EAF steelmakers. You can see from Tables 1 and 2 that:
I also compared the capital efficiency using gross profitability (gross profits/total assets) as the indicator. According to Professor Novy-Marx, this has the same power as Price Book Value in predicting cross-section returns of stocks.
As can be seen from Table 3, we see a similar pattern where Nucor and Steel Dynamics have better returns compared to the others.
The key takeaway from the above analyses is that companies with EAF deliver better margins and returns compared to those with Blast Furnace operations.
Table 3: Gross Profitability (Author)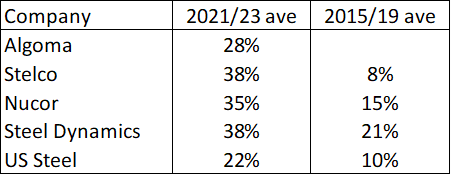
To get an estimate of the performance over the cycle, I derived a cyclical factor based on comparing the average 2015/19 values with the average of 2021/23 for the panel companies. The results are summarized in Table 4.
Taking into account the 3 metrics, on average, the 2015/19 performances are:
Table 4: Comparing the average 2015/19 with average 2021/23 (Author)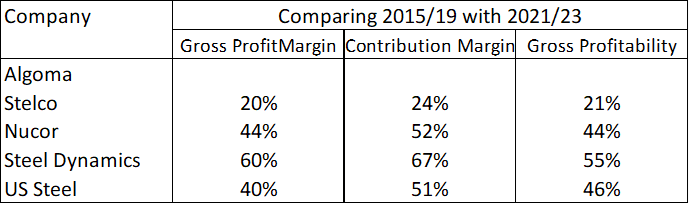
The above analyses provide a way to adjust Algoma's past 3 years' performance to account for its performance over the cycle, as well as the impact of transforming to an EAF steelmaker. These can then be used to estimate the intrinsic value of ASTL.
If you look at Chart 2, you will notice that there was no growth in the shipments for the panel companies from 2021 to 2023.
You should not be surprised, as there has not been significant growth in steel consumption over the past decade or so. The projected demand for steel also indicates a low growth rate. Refer to Chart 4.
This is a sector where there is currently excess capacity as reflected by the capacity utilization.
In the week ending on March 9, 2024, domestic raw steel production was 1,734,000 net tons while the capability utilization rate was 78.1 percent." American Iron and Steel Institute
Chart 4: Demand for Steel (Trading Economics and Grand View Research)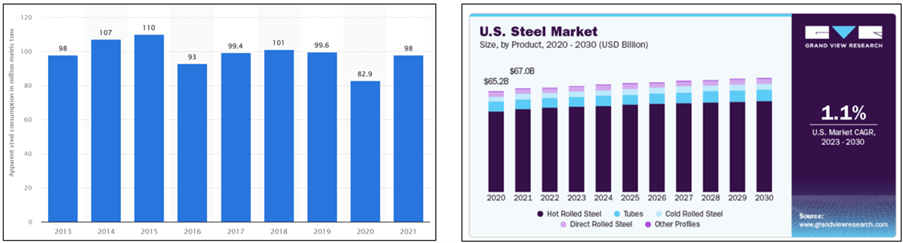
You would think that the infrastructure projects under the Inflation Reduction Act (IRA) and the Bipartisan Infrastructure Act of 2022 would boost steel demand. However, according to an article attributed to Wood Mackenzie, the demand for steel in the US will remain stable over the next few years after accounting for these.
This is because there is global excess steel-making capacity and there is always the threat of increased imports.
The key point is that when valuing ASTL, it is probably better to ignore growth and base it on the Earnings Power Value.
I would assess ASTL as financially sound based on the following:
Table 5: Sources and Uses of Funds FYE 2021 to FYE 2023. (Author)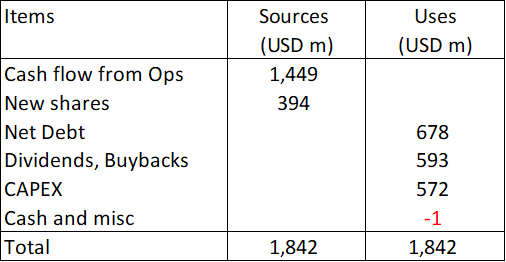
ASTL is a cyclical company going into the downtrend leg of the price cycle. Its strong financials would provide some safety if the downtrend part of the price cycle is more prolonged. At the same time, the strong financials would give it some leeway if it faces any hiccups during the transition to the EAF process.
I had earlier mentioned that valuing ASTL based on its EPV was more appropriate. On such a basis, I estimated the intrinsic value of ASTL to be USD 16.19 per share (CAD 21.88 per share).
The market price of ASTL as of 13 March 2024 was USD 7.78 per share (CAD 10.50 per share). This was equivalent to a 108% margin of safety.
In my valuation model, I adjusted the current performance to account for:
Table 6: Nucor and Steel Dynamics performance relative to Algoma based on the 2021 to 2023 performance (Author)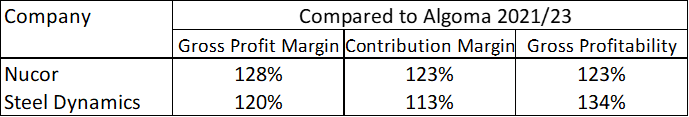
Because of the assumptions about the cycle and EAF factors, you should not focus on the quantitative aspect of the margin of safety. Instead treat the analysis as indicating that ASTL is currently under-priced. It is a value stock.
I valued ASTL based on the following.
Value of the firm = FCFF/WACC
FCFF = EBIT(1 - t)
EBIT = Gross profit - Selling, General and Administration cost
The Gross profit was derived based on the adjusted gross profitability. I adjusted ASTL's gross profitability based on the cyclical and EAF factors.
Value of equity = Value of firm + cash - Debt - Minority interests - value of warrants.
Table 7 illustrates the calculation.
Table 7: Valuation of ASTL (Author)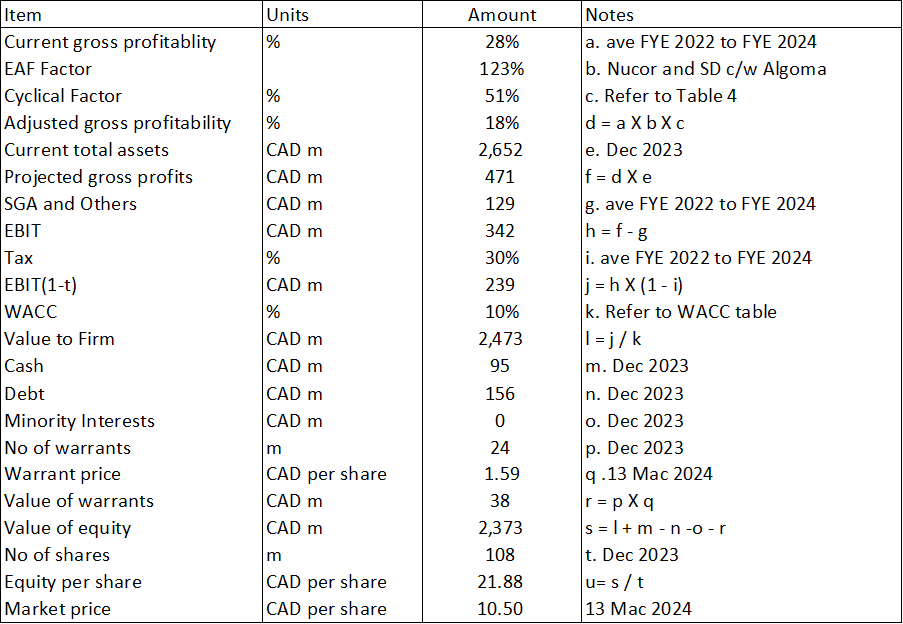
The WACC was based on a Google search for the term "ASTL WACC" as shown in Table 8.
Table 8: Estimating the WACC (Various)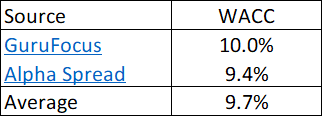
There are 2 issues when looking at my valuation:
I have assumed that ASTL would achieve the EAF performance immediately. If you assume that it would be another 4 to 5 years before ASTL gets the full benefit of the EAF operations, you should then discount my valuation by this timing factor. In mitigation, the high margin of safety meant that even if you discount the value by 50% (equal to discounting the WACC for 7 years), there is still a sufficient margin of safety.
Secondly, my cyclical factor assumes that steel prices would revert to the average 2015 to 2019 levels. If you believe that there is some fundamental change so that the long-term steel prices would be higher than what I have assumed, there would be another margin of safety.
My analysis focuses on estimating the value of ASTL over the cycle, taking into account its transformation into an EAF steelmaker.
Because of its short operating history, I had to look at its peers' performance to estimate:
Based on the above, I found that there is more than a 30% margin of safety based on the current market price. The other positive point is that ASTL is financially sound, giving it some leeway as it transitions to the EAF process. At the same time, this provides some safety if the downtrend part of the price cycle is more prolonged.
I am a long-term value investor and my analysis and valuation are based on this perspective. This is not an analysis for those hoping to make money over the next quarter or so.