
Jemal Countess/Getty Images Entertainment
Jemal Countess/Getty Images Entertainment
In recent times, U.S. debt issuances had become a flashpoint for brinkmanship between various factions of the political spectrum with the legislature. Currently, limits on the maximum allowable debt - which has seen a near-constant increase over the years - have been suspended until January 1, 2025. It can be assumed that the optics associated with the tussle and inevitable carve-outs that arose prior to each "debt ceiling" increase being approved was deemed inconducive, with protracted conflicts on procedure over each legislative action taking its place instead.
Overall, it can be seen that America's addiction to debt has definitive "epochs" in its history.
Source: Created by Sandeep G. Rao using data from the U.S. Department of the Treasury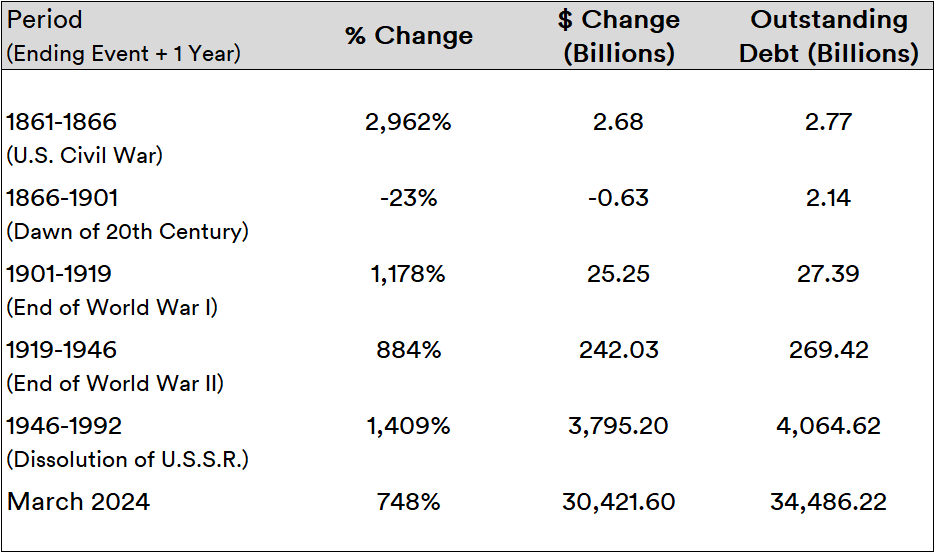
After a massive spike in debt during the Civil War, there was at least some attempt at prudence in the years leading up to the 20th Century. Since the dawn of the 20th Century, nearly every epoch has been met by at least a triple-digit percentage increase in debt. The Cold War period was indisputably the greatest epoch of increase: social benefits were enacted into law, military spending shot up to produce an ever-complexifying array of armaments to face off against the Soviet Union, and "urban improvement" measures attracted ever-increasing sums in intragovernmental transfers.
The dissolution of the Soviet Union and the end of the Cold War did little to halt the nation's habituation to living beyond its means. As of March 14 this year, total debt outstanding stands at $34.49 trillion. The activist think tank The Heritage Foundation uses U.S. government's own projections to show that there is no off-ramp for this habituation: within 30 years, the average debt imputed on a citizen born in 2023 is expected to rise at least 189%.
Source: The Heritage Foundation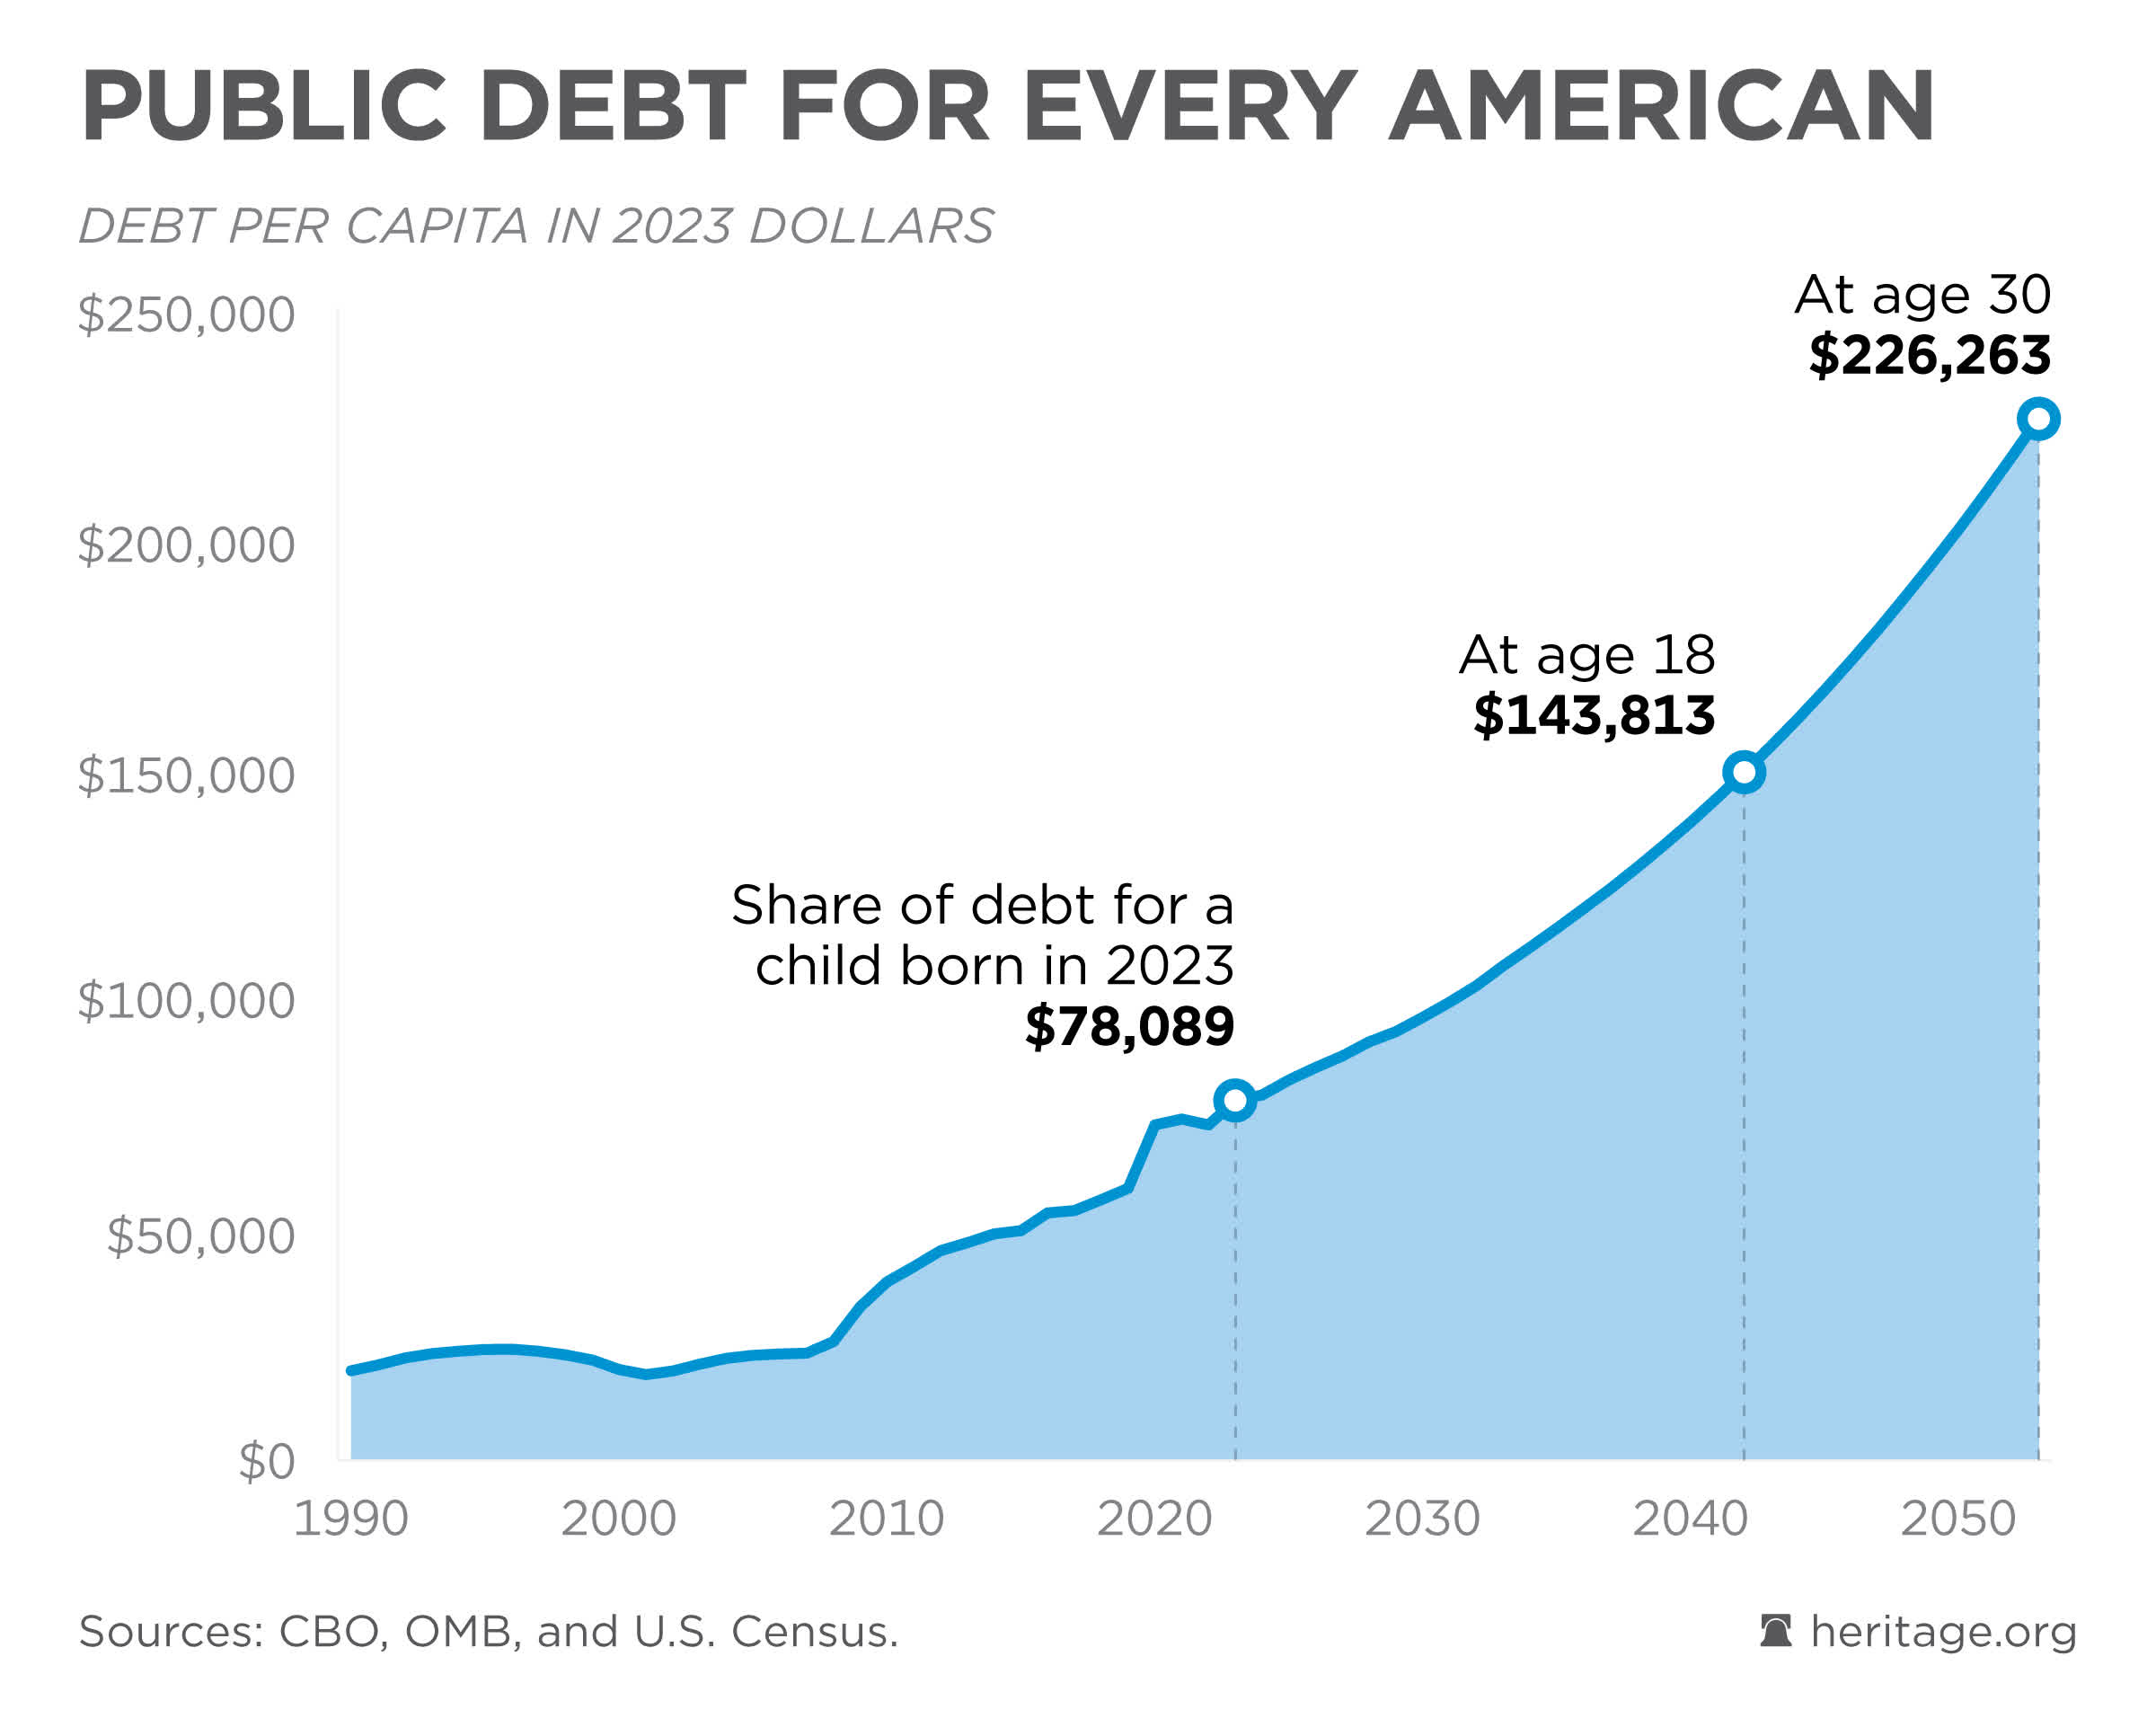
While social benefits account for the majority of the key drivers behind government spending, the interest payable on debt issuances are steadily catching up and accounting for nearly as much as Social Security.
Source: The Heritage Foundation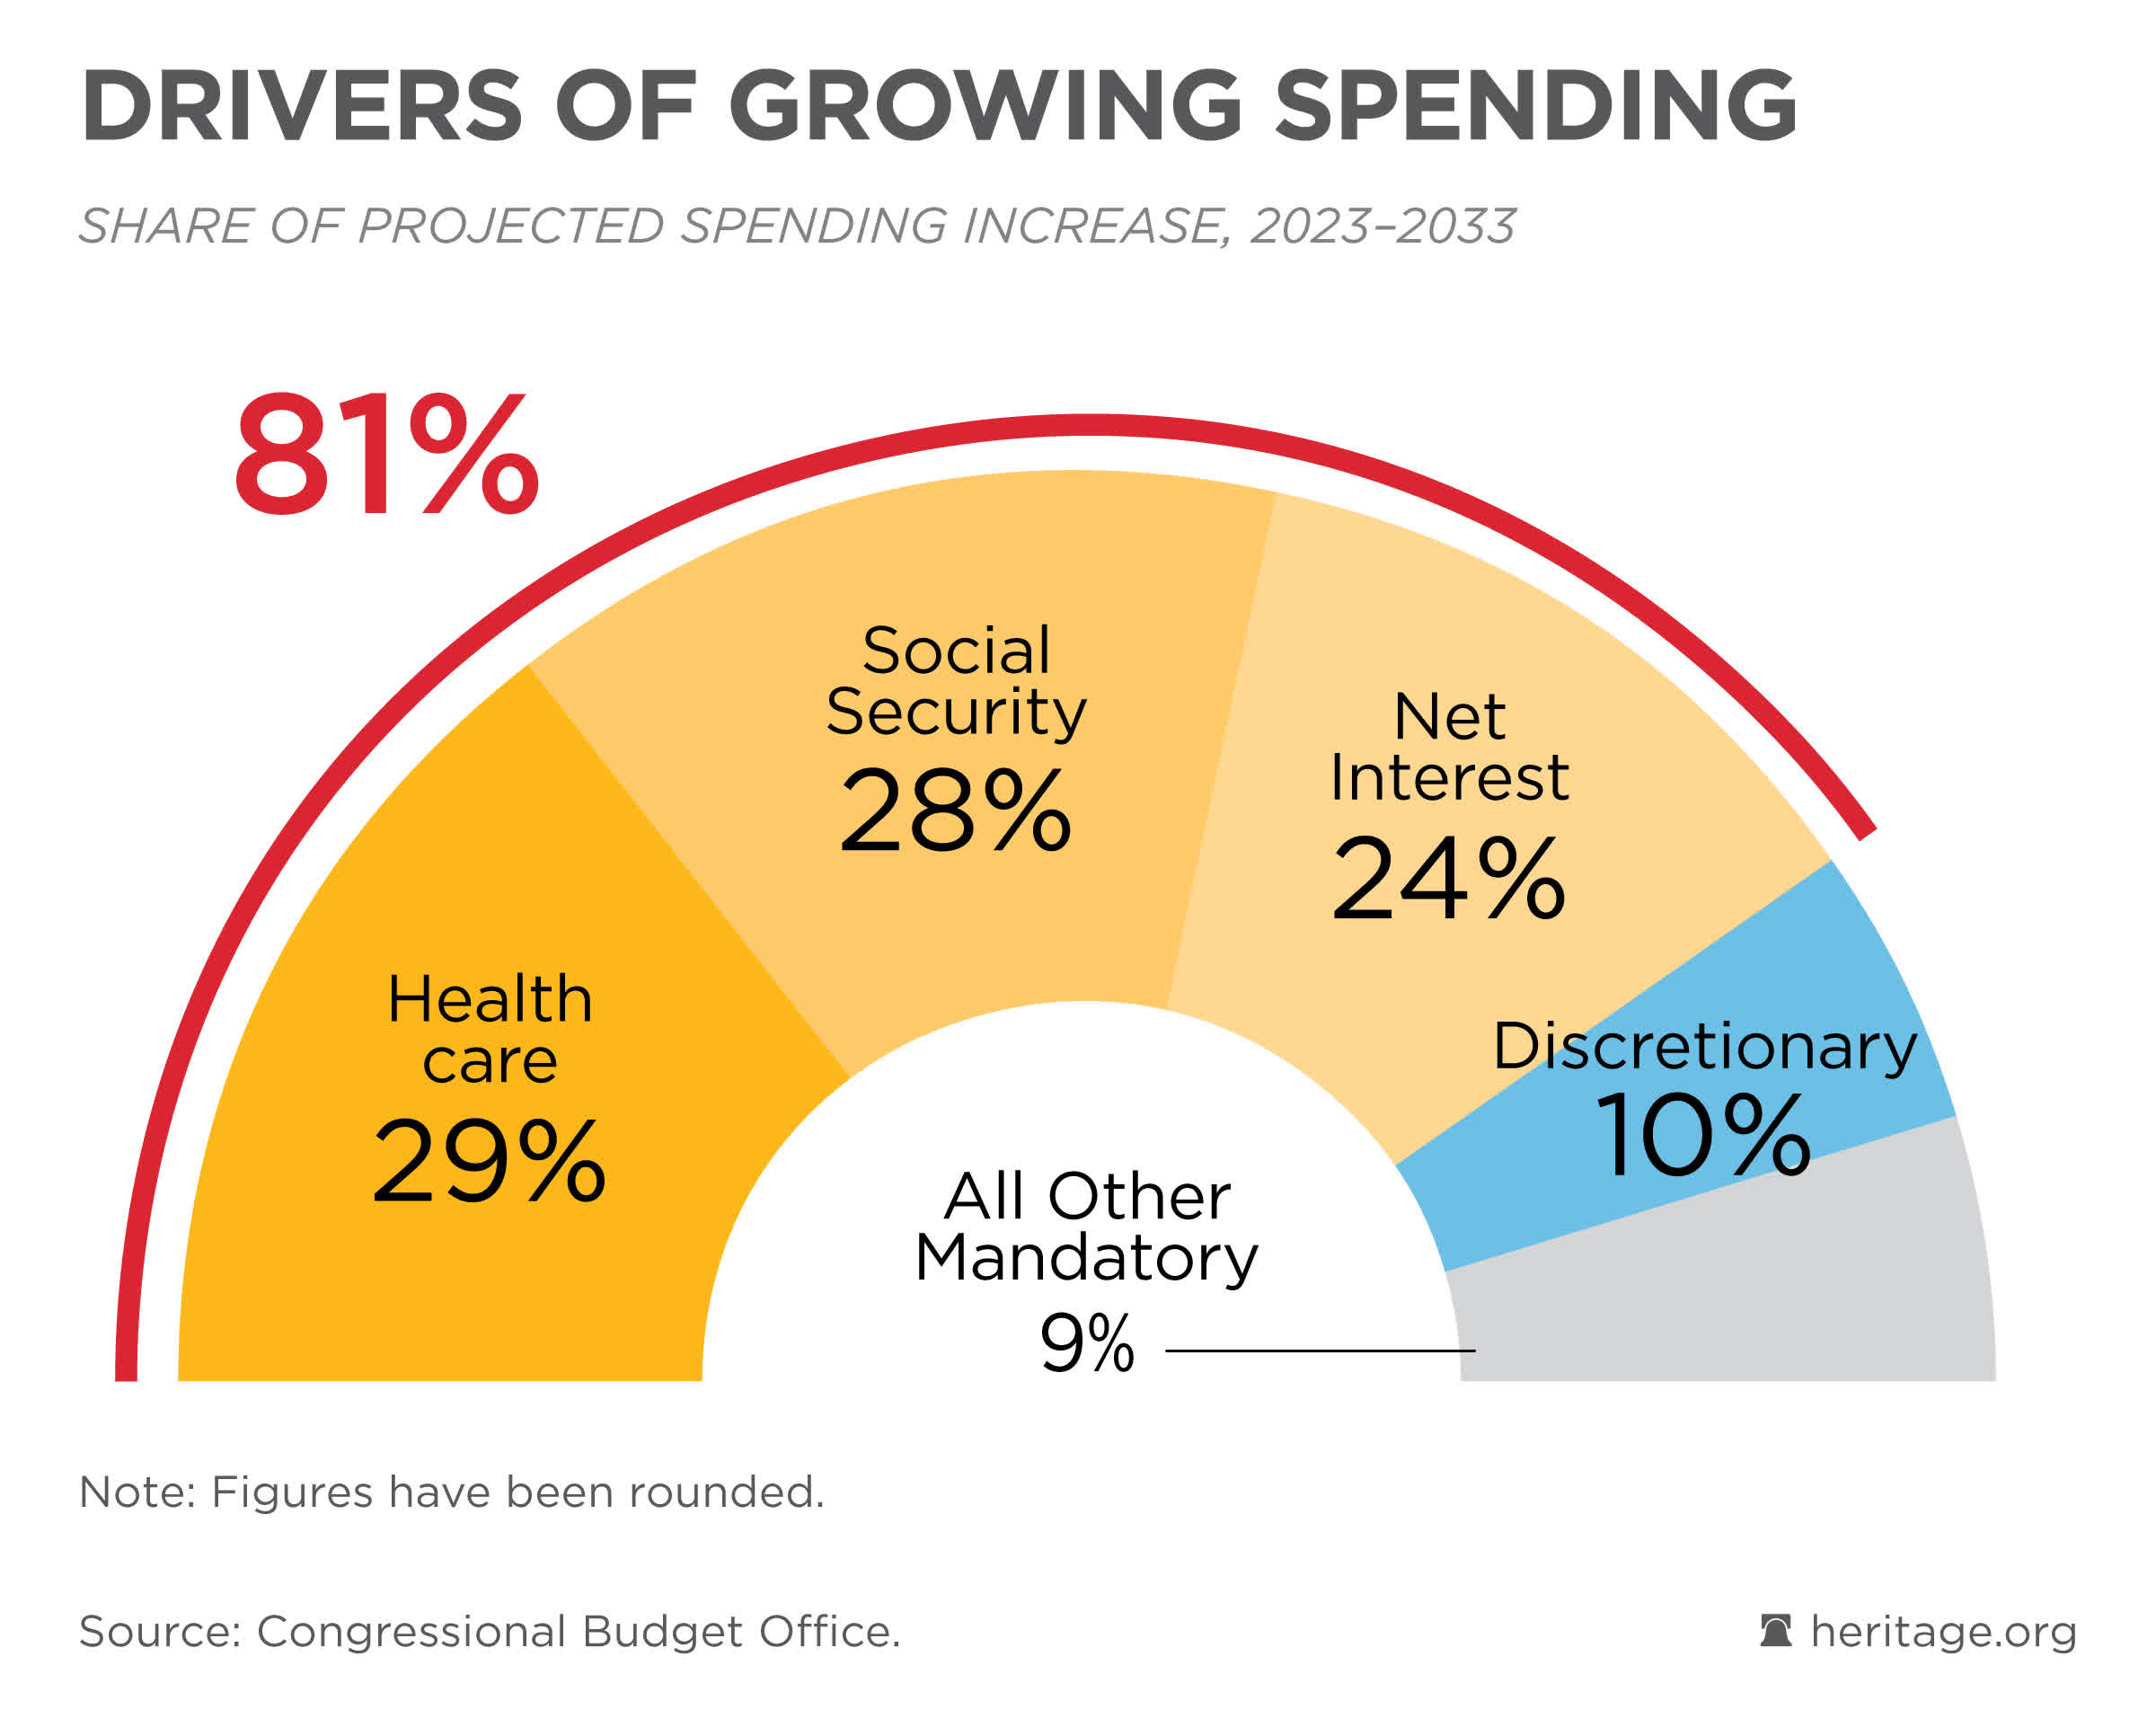
Over the course of this century, the U.S. government has never had a budget surplus (barring for one single year). If current issuance patterns continue, it is estimated that this deficit will continue to widen: before the end of this current decade, interest payments are slated to overtake all other drivers of spending.
Source: The Heritage Foundation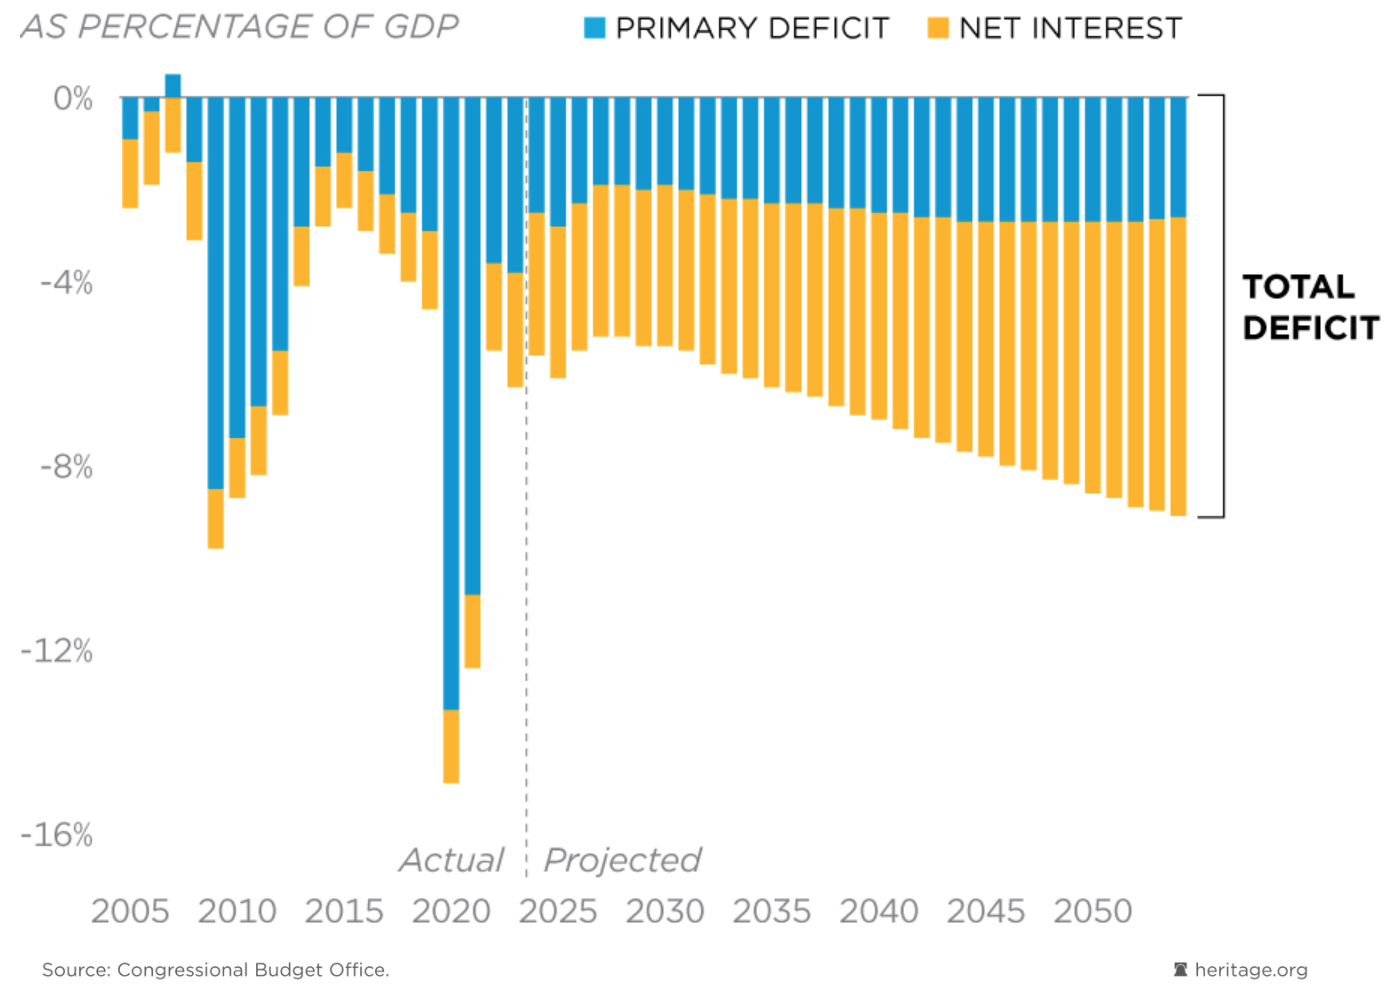
A recurring talking point among lawmakers has been government waste incurred due to fraud or other means. As per the U.S. government's own numbers, this is certainly true: over the course of the past two decades, a little under $2.5 trillion in payments in total were either improperly done or made to unknown recipients.
Source: Created by Sandeep G. Rao using data from the U.S. Office of Management and Budget (PaymentAccuracy.gov)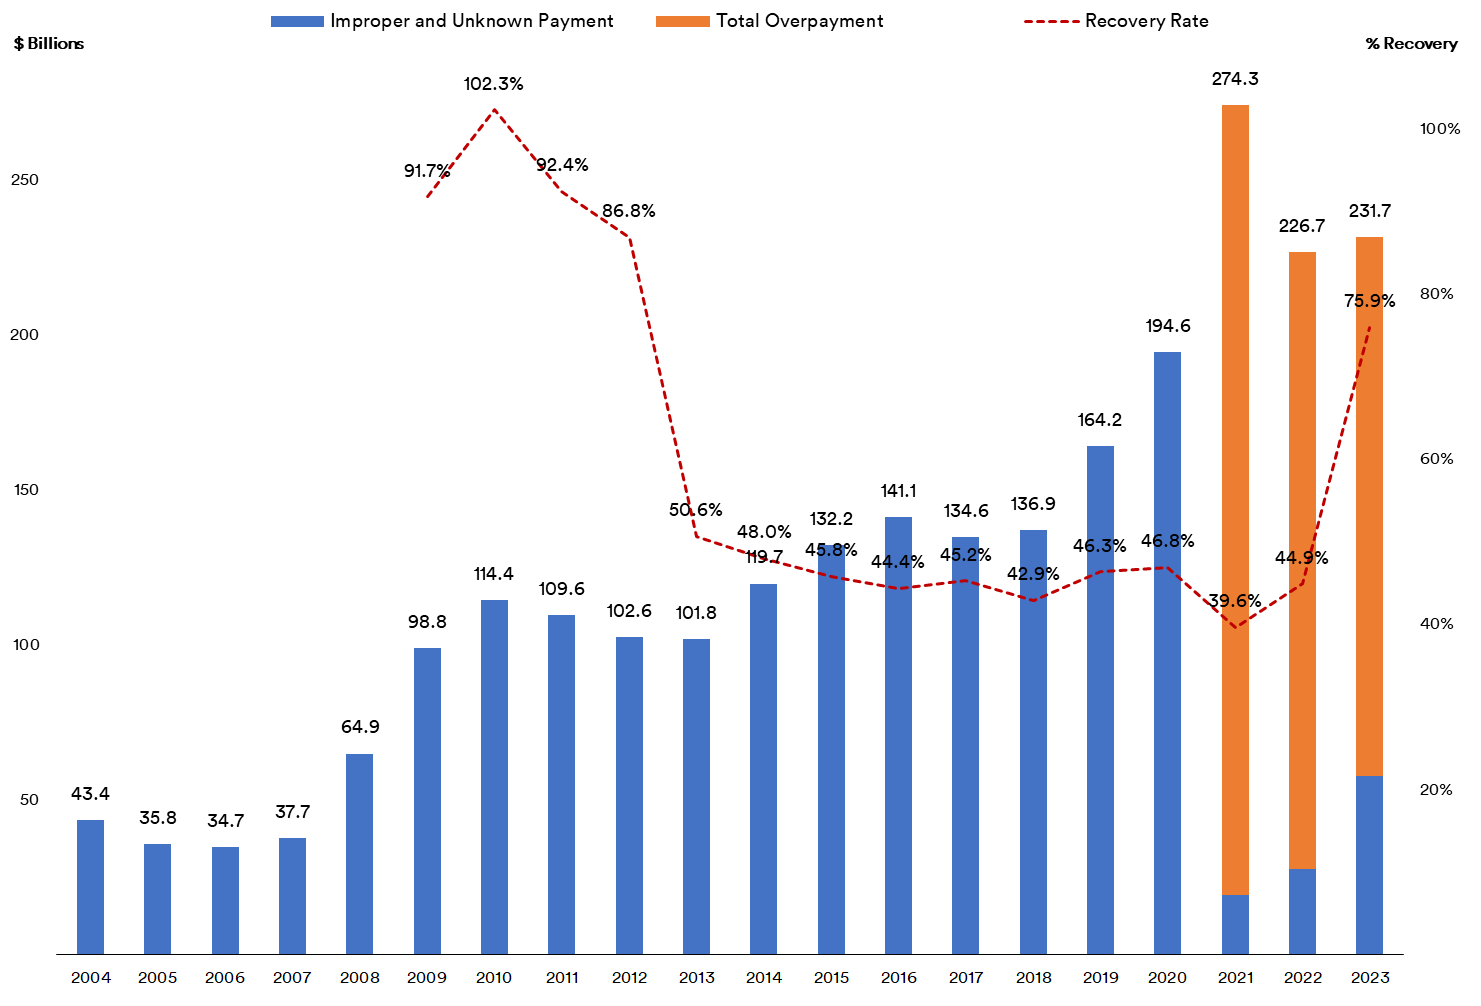
This doesn't mean that recovery is impossible: over the past decade, the government's recovery efforts has borne some fruit, with the quarter of a trillion in improper payments in 2023 reported to have a recovery rate of 75%.
It bears noting, though, that improper payments constitute only a fraction of government's debt issuances. In the Year Till Date (YTD) alone, the government has raised over $484 billion in debt issuances. Over the course of 51 days of debt activity so far, this translates to an average of $9.5 billion per day. 14 of the 51 days of activity saw debts being paid off but nearly each of these days was immediately preceded by a greater amount raised via issuances.
Now, given that each of these debt issuances translates to domestic spending, it stands to reason that this means dollars are being created in the system. Going by latest trends, around $1 trillion in currency is being "created" every 100 days. Thus, indicators should portray the value of the present-day dollar being in precipitous decline relative to historical values. The indicators don't necessarily do so.
It has long been argued that, over the course of time, money spent on purchasing goods and services isn't quite the same as money received as compensation for said goods and services or money held as wealth. The widely-cited Measuring Worth Foundation - a non-profit spun off the Economic History Association with most of the same datasets - attempts to capture the valuation of money in historical terms along these lines as determined by widely-quoted economic indicators such as the Consumer Price Index (CPI), the GDP Deflator, et al.
In numerical terms, the further back one goes in time, the larger the value of a dollar from said time period in the present day. When considering these values in annualized accrual terms (i.e., how much the value of the historical dollar rises on an average yearly basis till the present), however, the estimations intuitively might seem a little off.
Source: Created by Sandeep G. Rao using data from the MeasuringWorth Foundation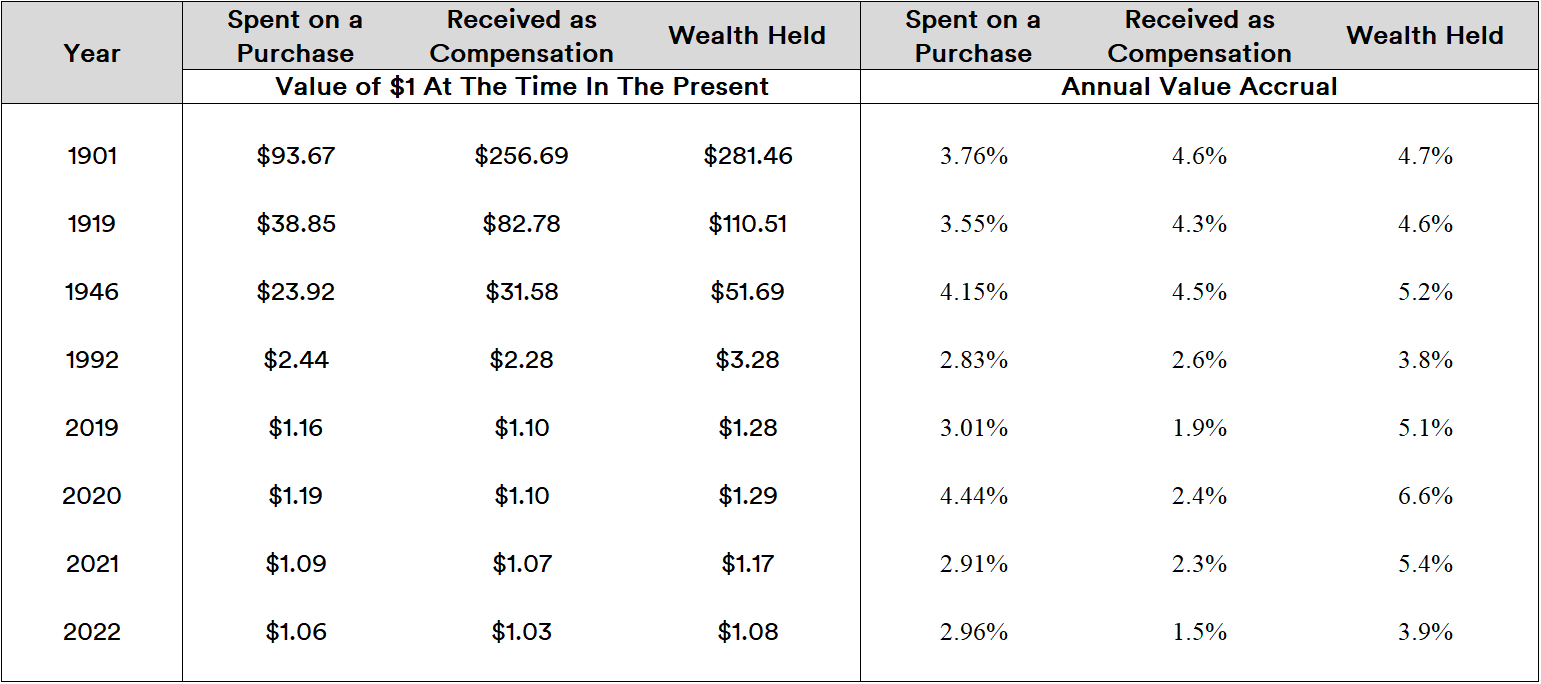
Considering the fact that total debt (and thus, "cash created") was nearly five times higher in 2021 than in 1992, one would expect the value of a dollar to be somewhat proportionately affected. The value accrual metric (and even the dollar equivalent amount) doesn't indicate this. Also, total debt is 12,211% higher in 2022 than in 1946, which certainly should have been reflected in a valuation far greater than the 1.5X accrual effect shown.
A further issue with the data: the values for 2023 are almost exactly the same in 2022, despite debt being 10% greater. This indicates the (lack of) sensitivity in the estimators relative to the volume of cash effectively in circulation. There are one or more of three likely reasons behind these discrepancies:
Factors 1 and 2 might be considered as being interrelated: if spending is limited by participants despite receipt of benefits, it is relatively difficult to price goods and services upwards instantaneously. However, given that there is ostensibly cash created, a continual rise of costs is inevitable as said cash gradually enters the system despite (for example) a recessive event having subsided.
(Incidentally, this is also the reason why "petrodollar" contracts ostensibly cushion the "true" effects of profligate dollar creation: when locked up in the central bank vaults of Riyadh, Abu Dhabi, et al, these dollars are effectively "out of sight, out of mind." When they're repatriated or contracts get "de-dollarized", as is the case in recent times, the cushioning begins to wear thin.)
Factor 3 is less-frequent but tangibly transformative. This is also why the likes of CPI are inherently unsuitable for observing long-term trends and capturing "true" dollar value. The indicators are supposed to be utilized for course corrections by government planners, whose remedies are persistent, continuous and also delayed in effects being tangible. Unfortunately, a large number of market participants tend to interpret the CPI "print" running "hot" or "cold" as signals for ramping up investments or pulling back. These indicators are largely meaningless for market decisions.
In a consumption-driven economy, the simplest estimation might be in terms how much consumers have to spend. This isn't a simple task: data is released at different times (or delayed/ discontinued/ redefined). Throughout the course of this century until 2022, it can be seen that Americans' spending potential is showing signs of severe strain on an annualized basis:
Source: Created by Sandeep G. Rao using data from Bloomberg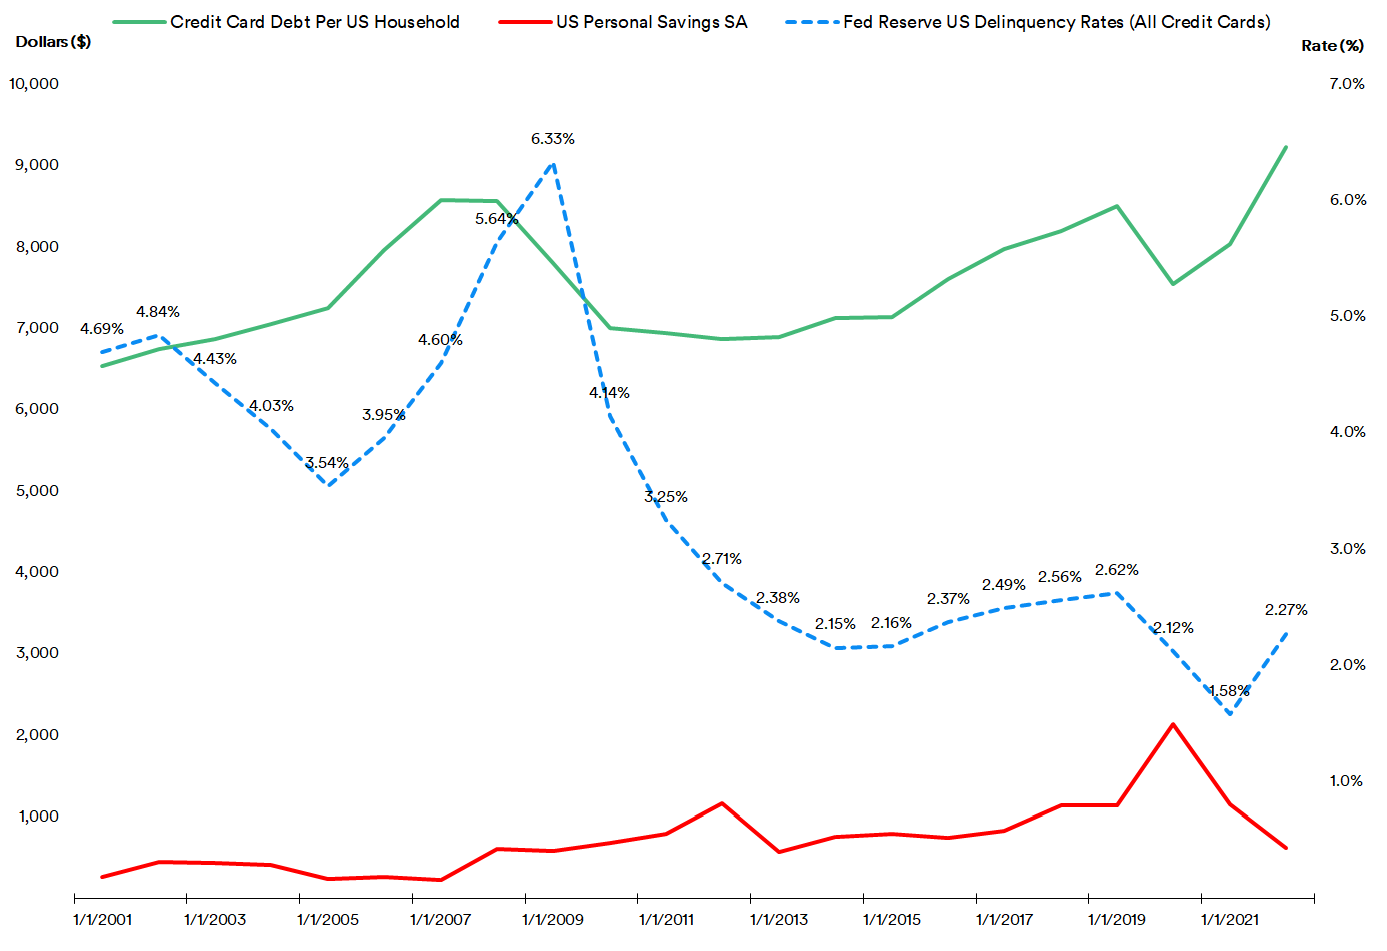
By the end of 2022, personal savings has seen a 70% fall from the highs witnessed in 2020 with credit card debt showing a 22% increase over the same period. 2022 ended with the highest amount in credit card debt for this century. Meanwhile, credit card delinquency rates witnessed a 43% increase in 2022 relative to the previous year.
While official credit card debt data isn't out for 2023 yet, the New York Federal Reserve Consumer Credit Panel did note in February that 2023 ended with the highest number of credit card accounts registered in the century so far:
Source: Federal Reserve Bank of New York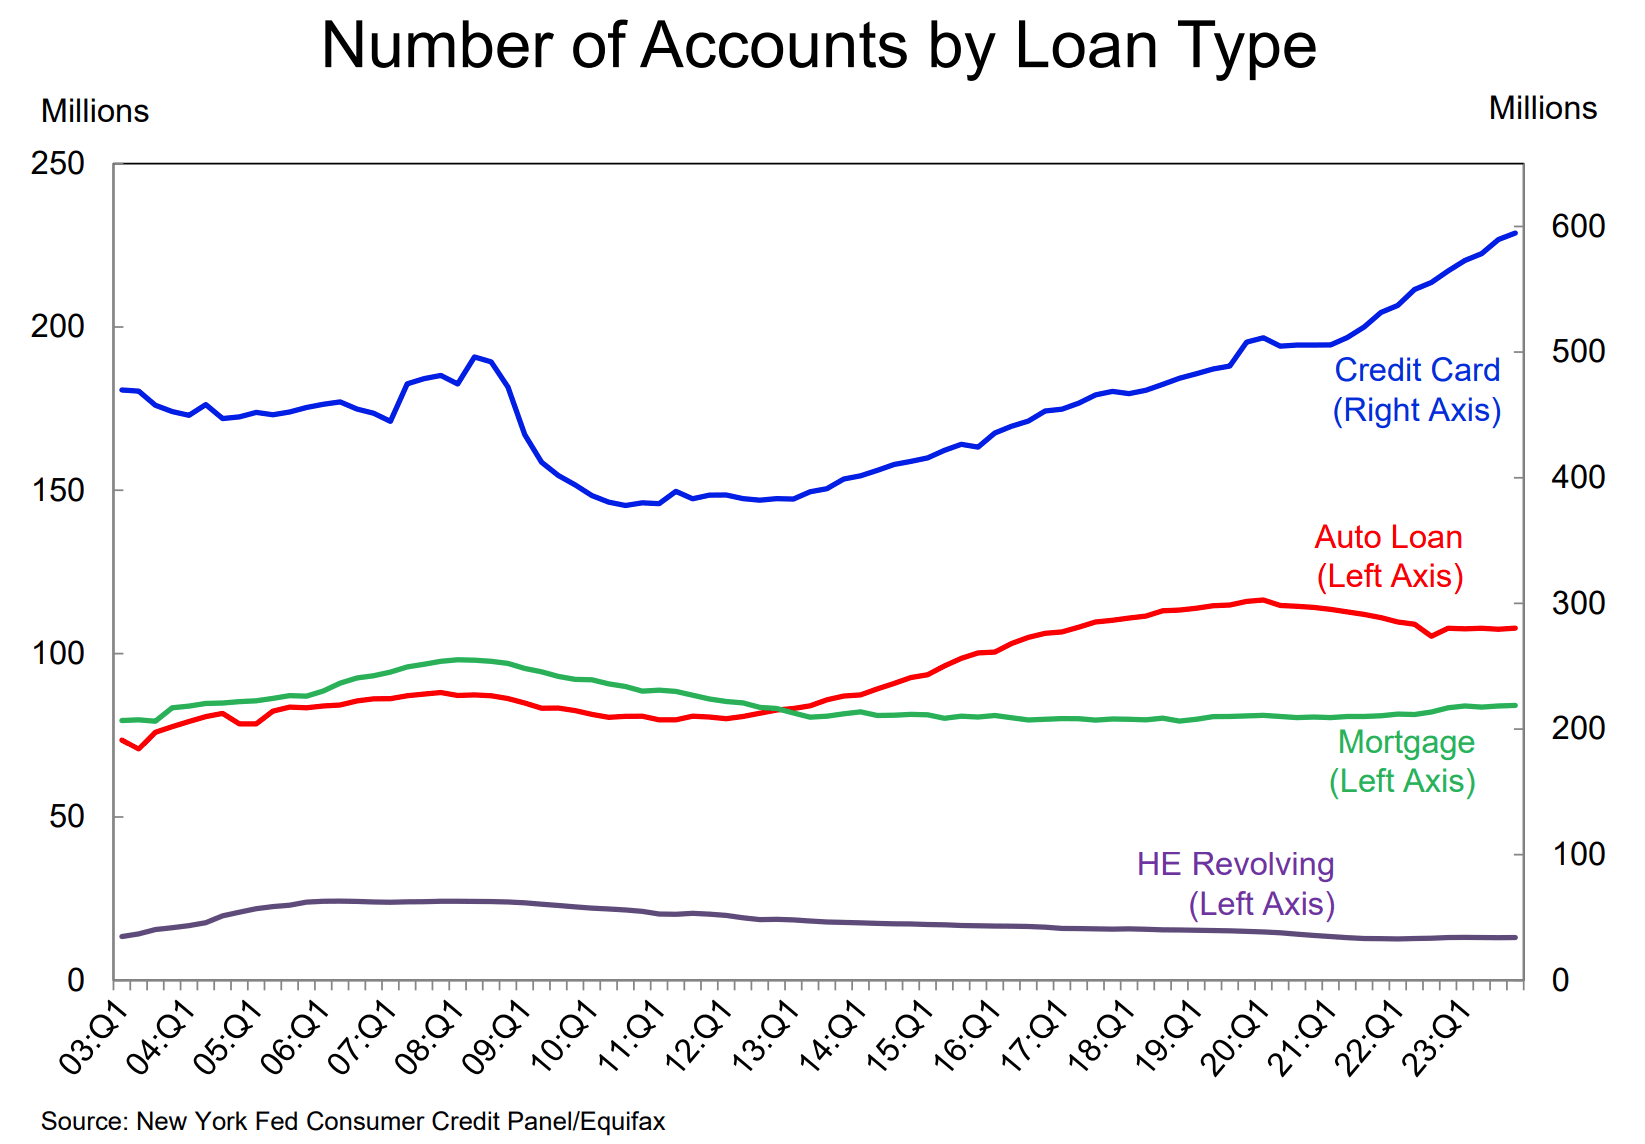
Auto loans, mortgages, and home equity revolving loans - in the meantime - are either trending flat or downwards. The panel also notes that credit card delinquencies, in particular, rose relatively rapidly in 2023.
Source: Federal Reserve Bank of New York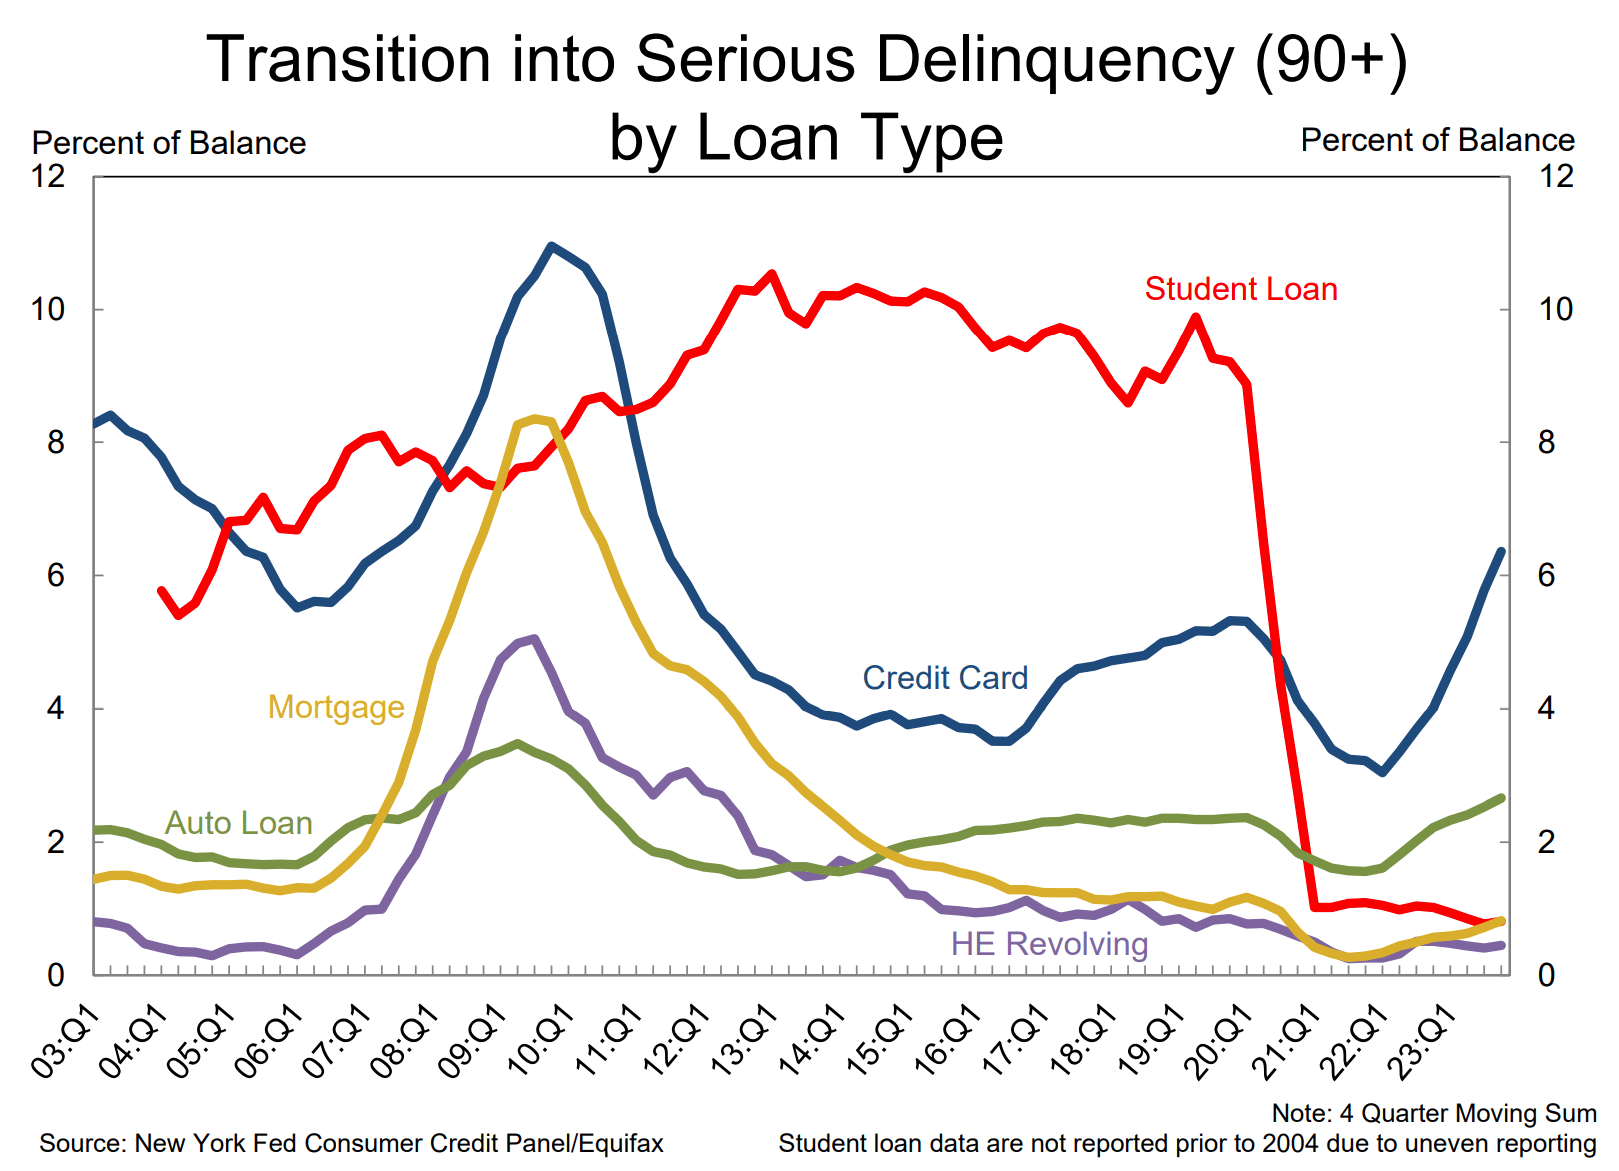
Auto loans and mortgages are also beginning to show rising delinquency while the student debt moratorium effectively flattens the historically-strong rates of delinquencies.
Other estimations across the board show additional trends: younger demographics are increasingly tending to shrink away from new car purchases and mortgages while older demographics tend to continue spending on long vacations, property purchases/upgrades, new cars, etc. A lifetime of value accruals advantages the latter; a lifetime of cost increases hobbles the former.
For the employed masses as a whole, relief by way of progressive wage increases isn't apparent in the present: recently-released data from the Federal Reserve Bank of Atlanta in fact shows wage growth slowing:
Source: Federal Reserve Bank of Atlanta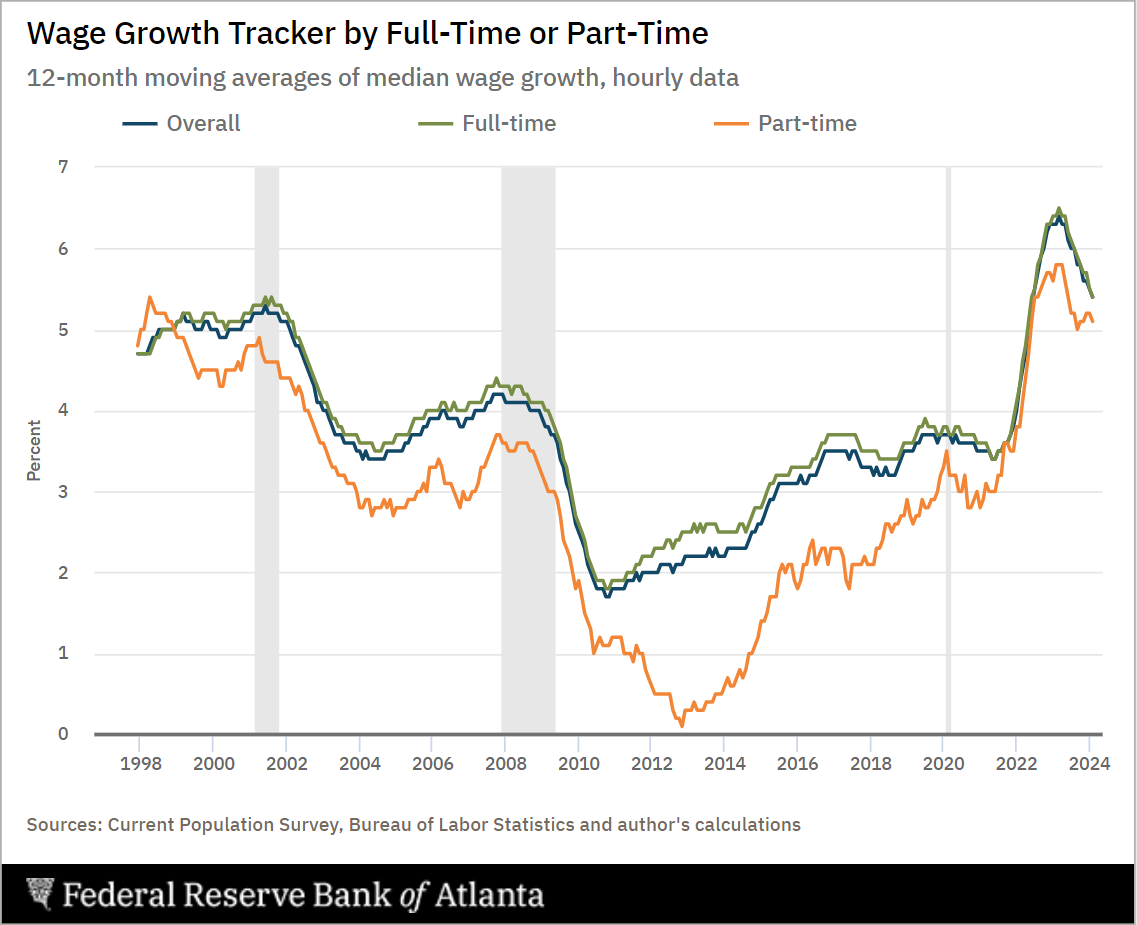
Given that a volume of economic data relating to 2023 was released throughout February, market turbulence with a distinct bearish flavor should be expected. Signs of this did emerge in recent weeks, with the most significant being in the broad-market S&P 500 (SPX in index form; SPY in ETF form).
In the first week of March, the index fell by 0.4% while in the second week, it largely remained flat. Within the index's sectors, there are seemingly growing trends of a reshuffle.
Source: Created by Sandeep G. Rao using data from Bloomberg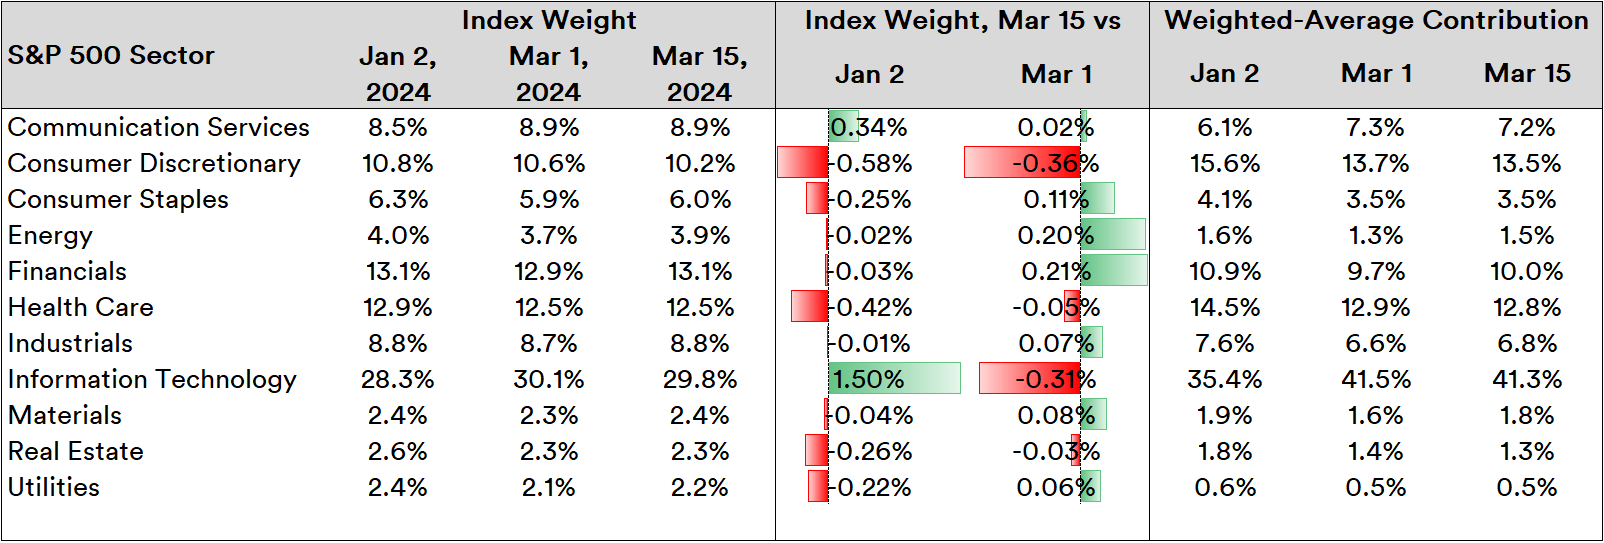
In the most recent week, nearly every sector except for Communication Services and Information Technology were in retreat relative to the start of the year. Relative to the first week, the most recent week shows nearly every sector showing weak signs of a rise, with the exception of Information Technology. Consumer Discretionary, which includes everything from the likes of Walmart (WMT) to Tesla (TSLA) and closely indicative of consumption outlook, remains bearish in both windows.
Consumer Discretionary and Information Technology hold the vast bulk of the index's highest-conviction stocks. In the start of the year, they accounted for 51% of the index's price. By the end of the most recent week, Information Technology continued to grow at the expense of nearly every other sector except for Communication Services.
However, not every stock in these two rising sectors is created equal nor is every stock in the "beleaguered" sectors rising together.
Source: Created by Sandeep G. Rao using data from Bloomberg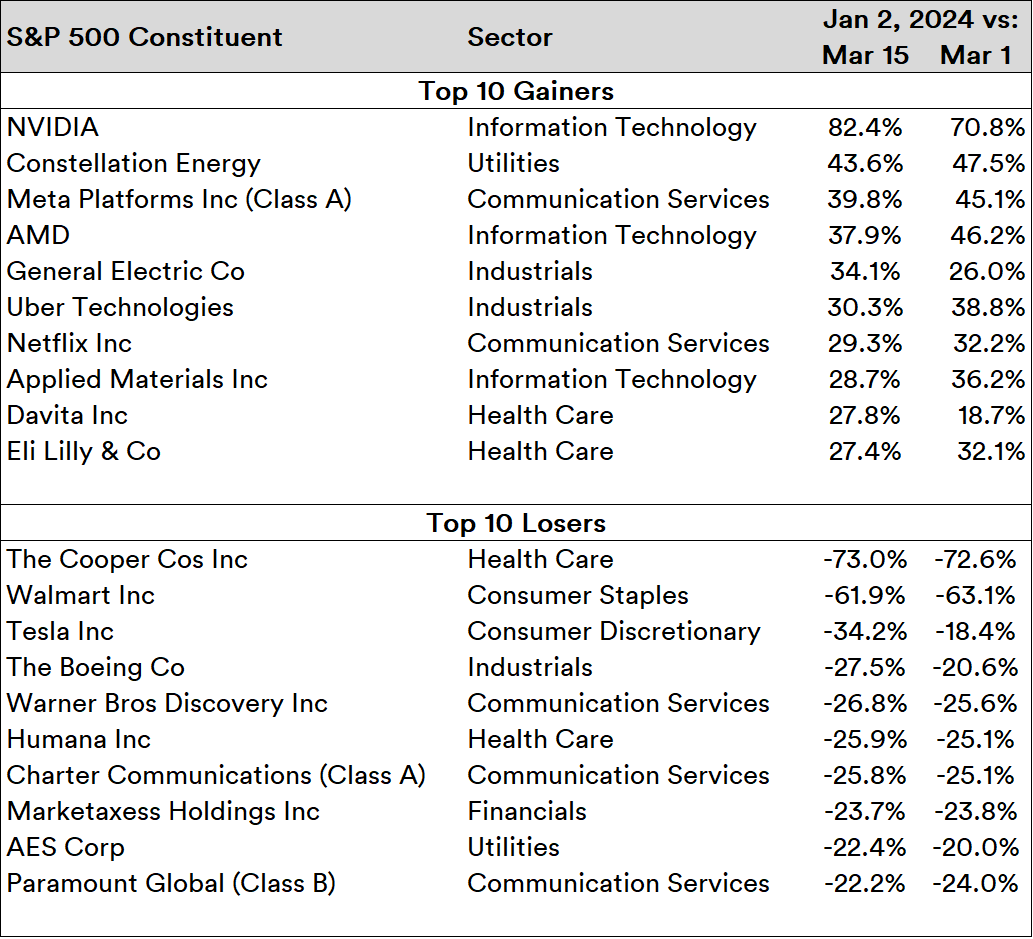
While "chip" stocks such as Nvidia (NVDA), Advanced Micro Devices (AMD) and Applied Materials (AMAT) easily feature in the Top 10 Gainers, a small group of industrial stocks and utilities - two of the most beleaguered sectors relative to their weights - are resilient and consistent winners.
Being in Communication Services - one of the strongest performing sectors in the YTD - didn't help Warner Bros. Discovery (WBD) or Paramount (PARA); both companies have continued to hemorrhage value. Gloomy consumer outlook affects both Walmart and Tesla - which are two radically different companies - while a steady line of aircraft failures hammer away at Boeing (BA), one of the few remaining major aircraft manufacturers in the post-Cold War world.
Given that the Nasdaq 100-Index (NDX in index form and QQQ in ETF form) has fewer constituents and heavier "tech" presence, an examination of trends in March might help further contextualize market trends. Sector-wise, the tale writ is largely similar:
Source: Created by Sandeep G. Rao using data from Bloomberg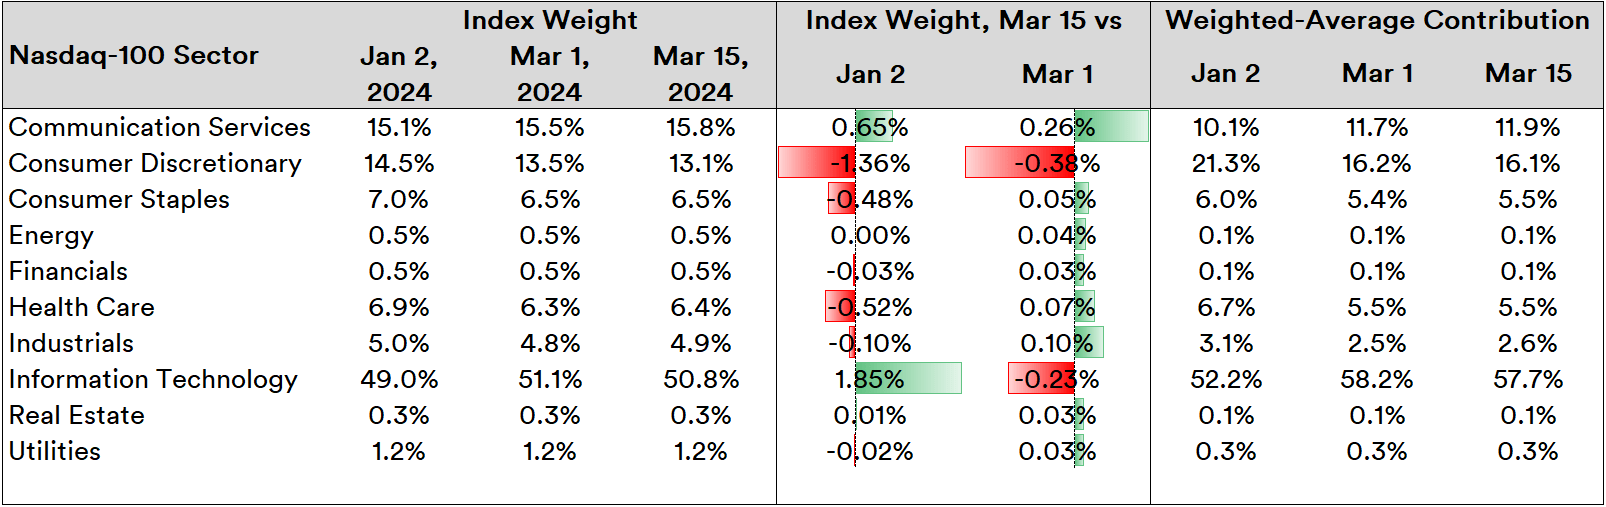
Information Technology and Consumer Discretionary are net down relative to last week while nearly every other sector is showing weak signs of a rise. Despite this, relative to the start of the year, Information Technology is still up while Communication Services shows resilience in both windows.
Source: Created by Sandeep G. Rao using data from Bloomberg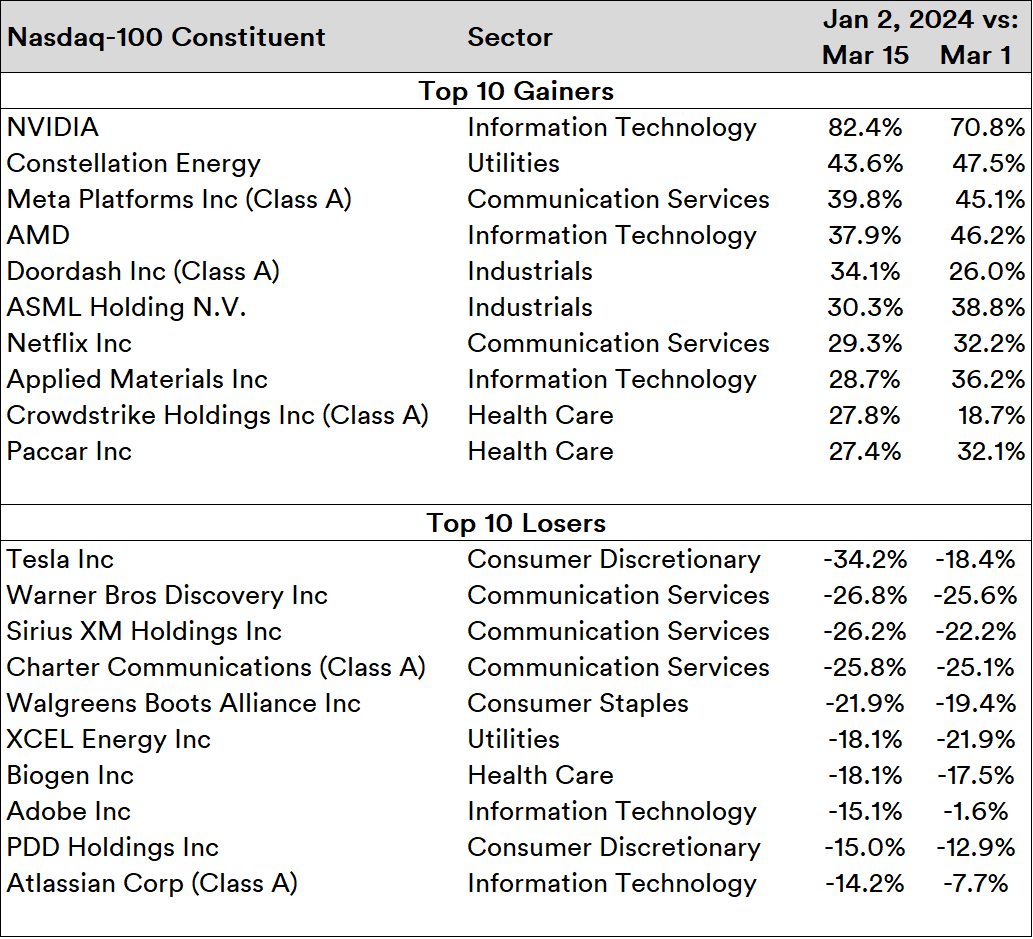
Much like the broad index, the tech-heavy index shows "chip" stocks leading a resilient rise with a handful of stocks from beleaguered sectors included. Tesla is by far the biggest loser in valuation in the YTD while communication stocks such as Sirius XM (SIRI) and cable service provider (CHTR) form the middle lineup of the loser list. "Tech giant" Adobe (ADBE) has been in major correction territory over the most recent week, along with Atlassian (TEAM) which doubled its loss over the past week.
Instead of a sector rotation - which could be construed as market participants rationalizing away from overwrought valuations in "tech"-related sectors in light of improving economic conditions - major trends highlight that market breadth continues to be weak, with investors continuing to flock towards a small set of stocks independent of sector.
The key takeaway of large-scale economic data juxtaposed with emerging trends in the market strongly suggests that "consumer-facing" companies are in for a rough ride over the next few quarters. In contrast, the likes of major "chip" stocks and communications majors that have a preponderance of "corporate" clients find themselves in favor as corporations are expected to be more resilient spenders than the average American citizen going forward. Hence, market breadth is expected to be bleak.
However, there are limits as to how far forward-looking valuations can be stretched. Even with "corporate"-facing stocks leading the way for indices, there is ample potential for snapbacks and bearish volatility. Giving how entangled the legislature currently is and is likely to remain even after the elections, it is virtually a given that there is no stomach for pushing through stringent measures that might eventually pave the way to sustained prosperity for the bulk of America's masses.
All in all, caveat emptor.