
Apriori1
Apriori1
Ally Financial (NYSE:ALLY) is a dominant player in the auto loan space; that's their core business. They aim to obtain net interest income from auto loans in addition to selling insurance on autos. 88% of their revenues come from those two verticals, while the remaining includes sources such as mortgages and corporate finance, which remain a small part of Ally's business. In this analysis, I will go through Ally's financial results and illustrate how the interest rate hike regime affected their numbers and key metrics. In addition to discussing the stock movements, I'm comparing it against its major competitor, and laying out their underlying risks and outlook to come up with a BUY rating.
New York Fed 2023, Federal Reserve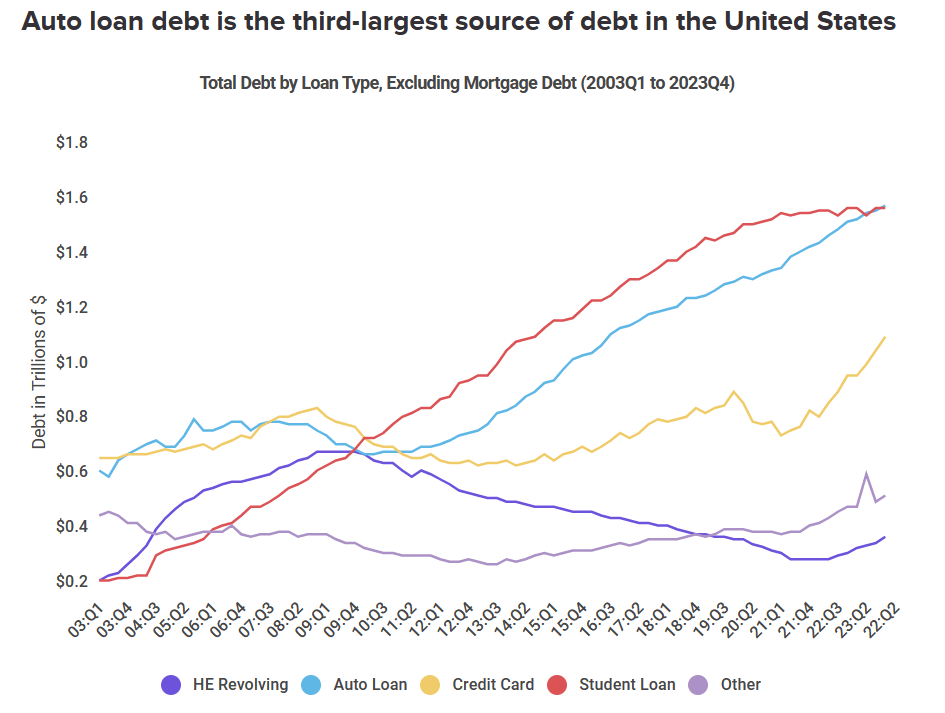
So, with that, let's have a brief look at the auto loan industry in the United States. To put you in context, auto loans, after mortgages and student loans, are the third largest type of debt for US households. In 2022, 88% of new car purchases and 40% of used car purchases were financed, with an average loan of $40,290 per new auto, and an exorbitant amount of $1.6 trillion in debt is currently outstanding.
Statista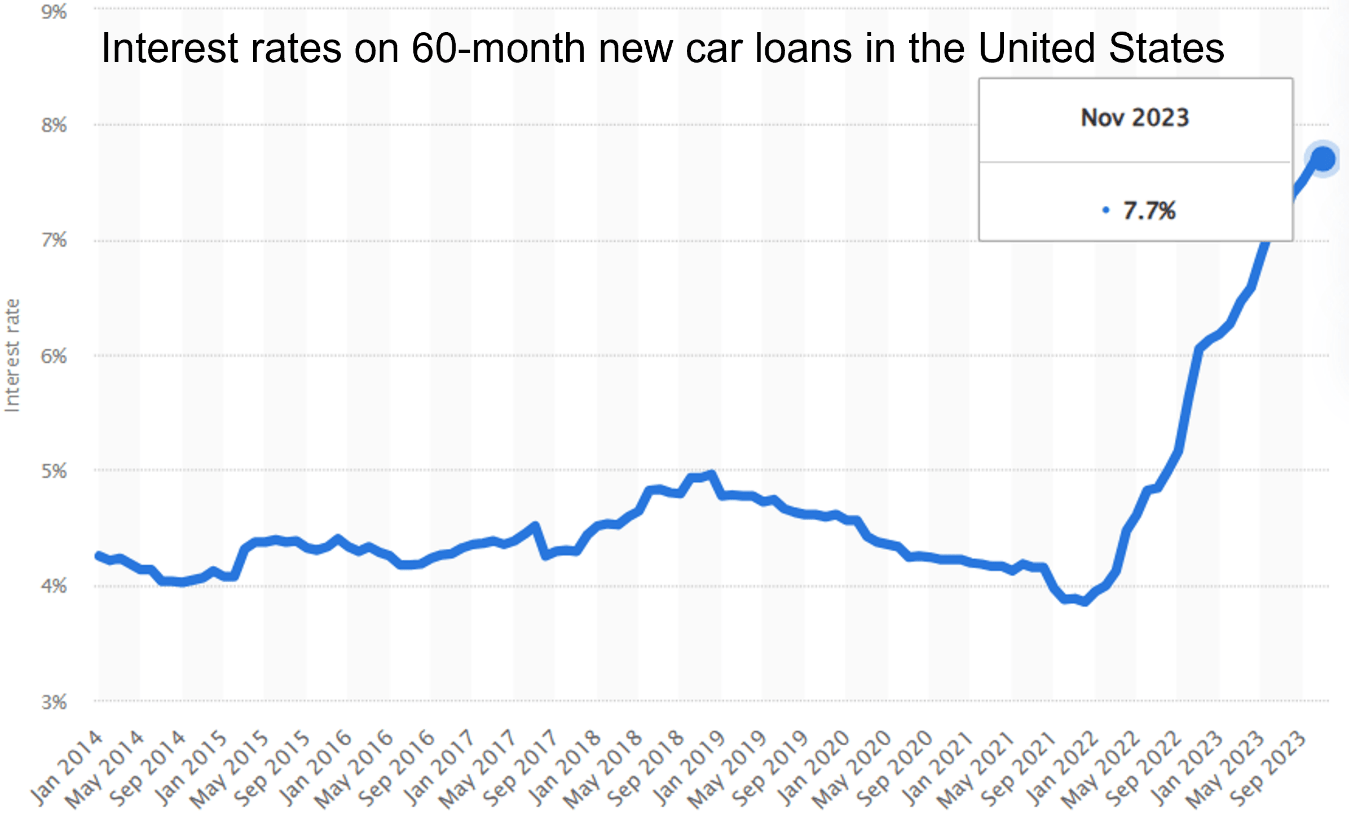
As you might have expected, the industry is facing distinct periods of high interest rates that all else constant, disincentivize customers from borrowing. Even more when we are factoring high ticket nonperishable items into the equation. As seen in the graph above, the average interest rate for a new car to be paid in 5 years is at 7.7%, compared to 2021 bottom of 3.9%. Hence, someone who takes a 5-year loan to buy a $50,000 car, would now be making monthly payments of $1,007. Not so long ago, it would've been $919 instead.
TradingView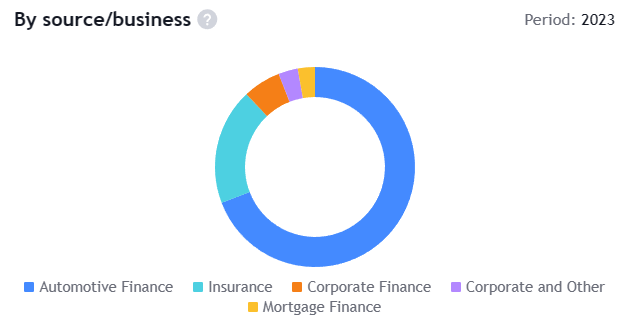
Many of you might have heard about Ally's high yield savings account that currently offers a handsome 4.35% APY, and how it compares to accounts such as SoFi (SOFI), Wealthfront, or UFB Direct. Or heard that even though they are a digital bank, they offer free ATM withdrawals, and if you withdraw from non-partnered ATM systems, they reimburse you up to $10 per month. Well, since its IPO, Ally changed its financing strategy and started to seek higher sums of deposits from retail customers. Perhaps that's why many people know them for their online banking service. But sure, their core business heavily remains in the auto loans and has done it for decades when the company was founded in 1939. As of the last earnings presentation, the company reported more than 22,000 partnerships with car dealerships, which allowed them to receive 13.8 million loan applications from customers in 2023.
Ally's Q4 2023 Earnings Presentation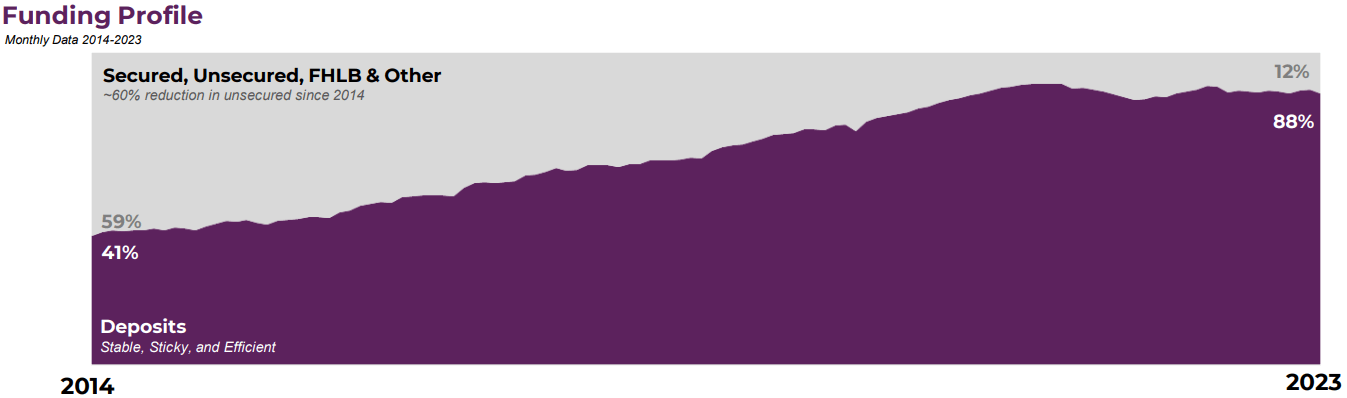
On the graph above, you can see how the funding profile has positively shifted the customer deposits weight since its IPO. Although the mix has consolidated several years ago, it remains quite elevated, and generally a more charming funding profile for a bank. Customer deposits technically have a zero duration, as they can be withdrawn pretty much at any time. Nonetheless, they are considered as one of the most stable sources of funding.
In finance there is no free lunch. For customers to deposit their funds on Ally's savings accounts, they were induced with the high yield rates. That of course makes the funding more expensive, even more during these scenarios of elevated interest rates. As for comparison Chase Bank pays 0.01%, but Ally and other neo banks have the advantage of operating fully digitally, reducing real estate rents and in-person personnel.
(Source: Author's editing | Data: Seeking Alpha)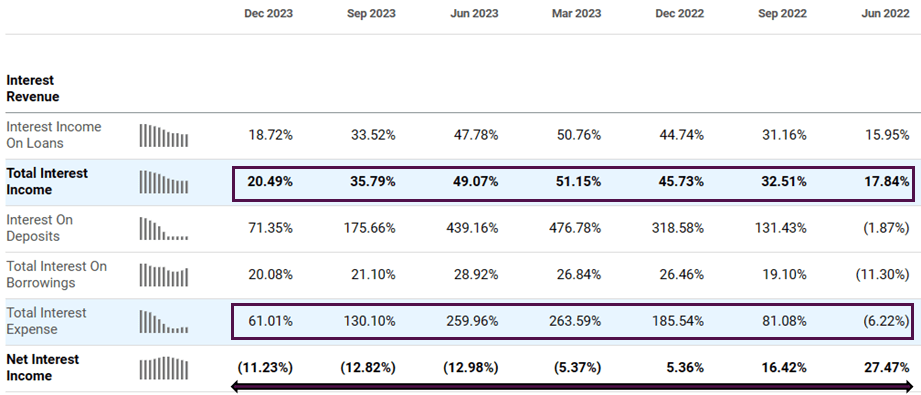
Diving into Ally's interest revenue, we can see that early in the rate hike environment, total interest income (TII) started a period of growth, mainly due to higher interest rates on loans originated and also an increase in customers deposits attracted by competitive rates. Nonetheless, Ally now had to pay depositors with higher compensations, so the total interest expense (TIE) also began rising. Netting out the results, the expense component growth was sadly superior to the income component, making net interest income (NII) to decrease in the last four quarters.
The table does not illustrate this, as it's based on percentages, but the absolute NNI in Q4 2023 and Q2 2022 (when rate hikes started for the full period), was of $1,344 billion and $1,587 billion, respectively. Representing a decrease of -15.3% during this rate hike regime. In terms of net interest margin (NIM), since that measurement period, we can see that the company didn't improve. In Q2 of 2022 NIM was of 4.04% vs. 3.17% in Q4 of 2023. Therefore, we can conclude that this rate hike period did not benefit the company in terms of NII profitability nor margin expansion.
(Source: Author's compilations | Data: Company's Financials)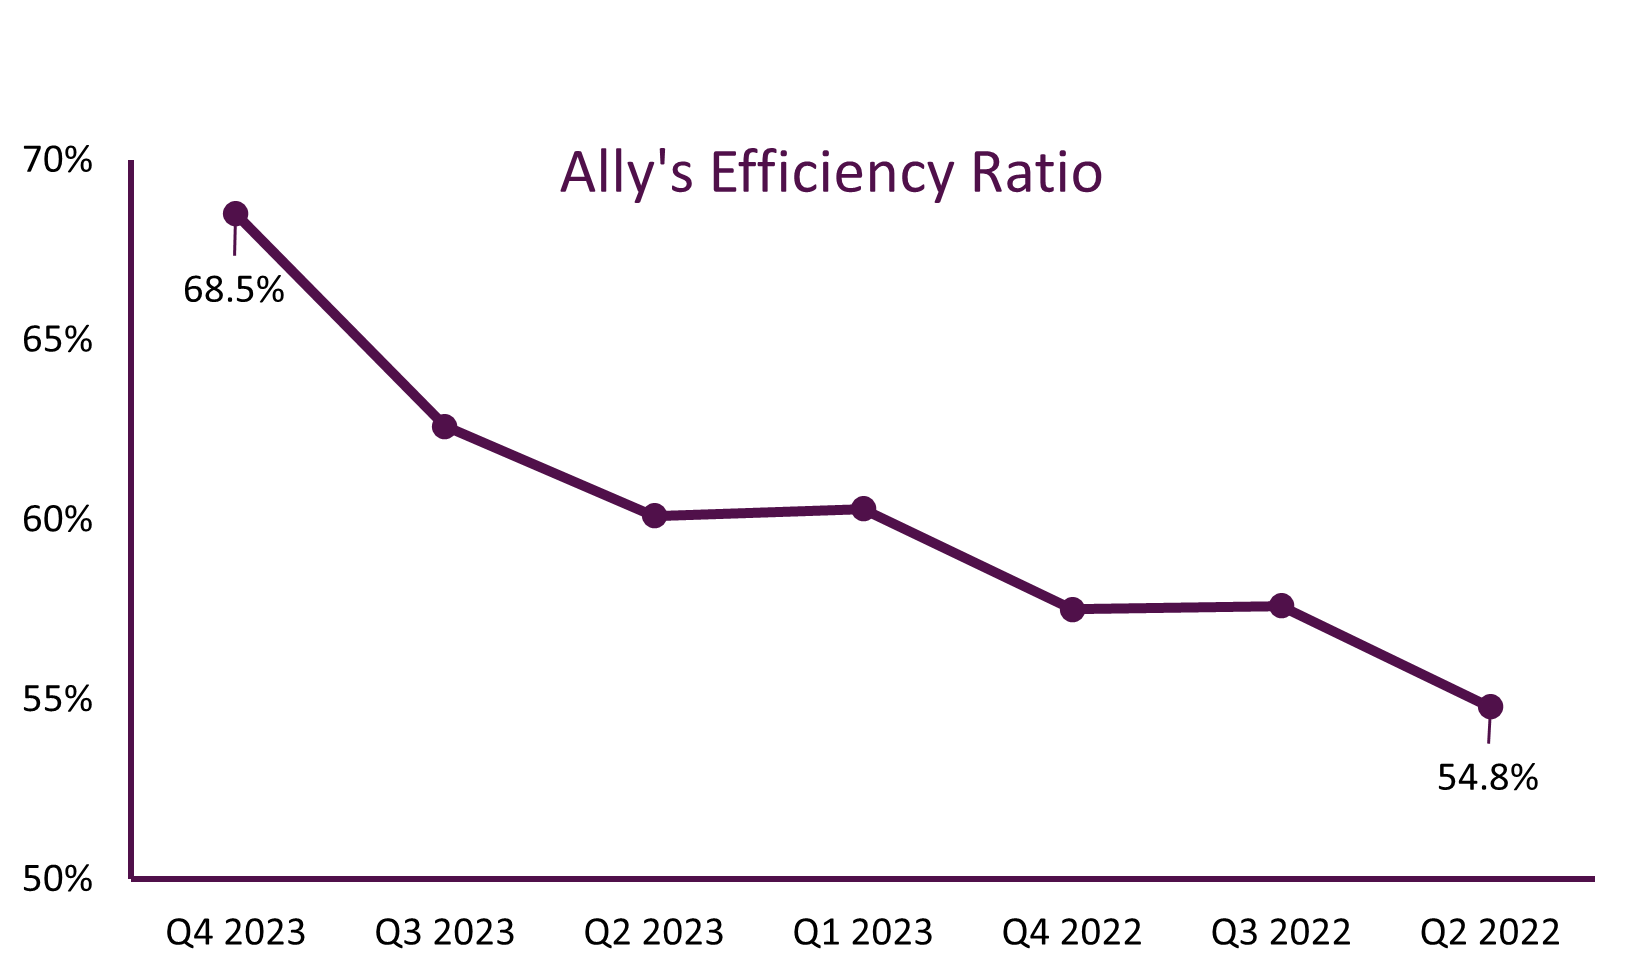
Another key rate to observe for a bank is the efficiency ratio, which is a formula that has non-interest expense (real estate, payrolls, etc.) divided by both interest and non-interest income net of provision losses. Hence, the lower the ratio the better. Unfortunately for Ally, this ratio has been expanding since the first interest rate hike in 2022. Again, consistent with NNI, efficiency ratios were affected, passing from 54.8% to 68.5%, which is the equivalent of a 25% increase in six quarters.
Q4 2023 | Q3 2023 | Q2 2023 | Q1 2023 | Q4 2022 | Q3 2022 | Q2 2022 | |
Revenue Before Loan Losses | 2,289M | 2,180M | 2,279M | 2,326M | 2,441M | 2,254M | 2,295M |
Provision For Loan Losses | 587M | 508M | 427M | 446M | 490M | 438M | 304M |
Provisions / Revenues | 25.6% | 23.3% | 18.7% | 19.2% | 20.1% | 19.4% | 13.2% |
(Source: Author's compilations | Data: Company's Financials)
Last, the ratio of provisions against revenue has also been deteriorating from quarter to quarter. This suggests, that per dollar of revenue, the company is setting aside higher amounts of funds because they believe more defaults are coming. Well, this makes sense since higher interest rates bring zero benefit in refinancing an old loan, other than increasing the maturity during troubled times, and even with that, the prolongation of the loan would have to be significant for the monthly installments to decrease. Especially, with the aggressive changes in rates.
For the valuation, I tried to compare Ally with peers that are pure players of auto loans. Credit Acceptance Corporation (CACC) was undoubtedly the best public company to compare Ally and it falls within a comparable market cap level. Medallion Financial Corp. (MFIN) and Consumer Portfolio Services (CPSS), comply with the fact that they are pure auto loan players, but they have significantly less market cap and are considered micro caps. Even though in comps comparisons there are always trade-offs, I won't include them on this analysis, and will just stick to compare Ally directly with Credit Acceptance as a one-to-one play.
(Source: Author's editing | Data: Seeking Alpha) (Source: Author's editing | Data: Seeking Alpha)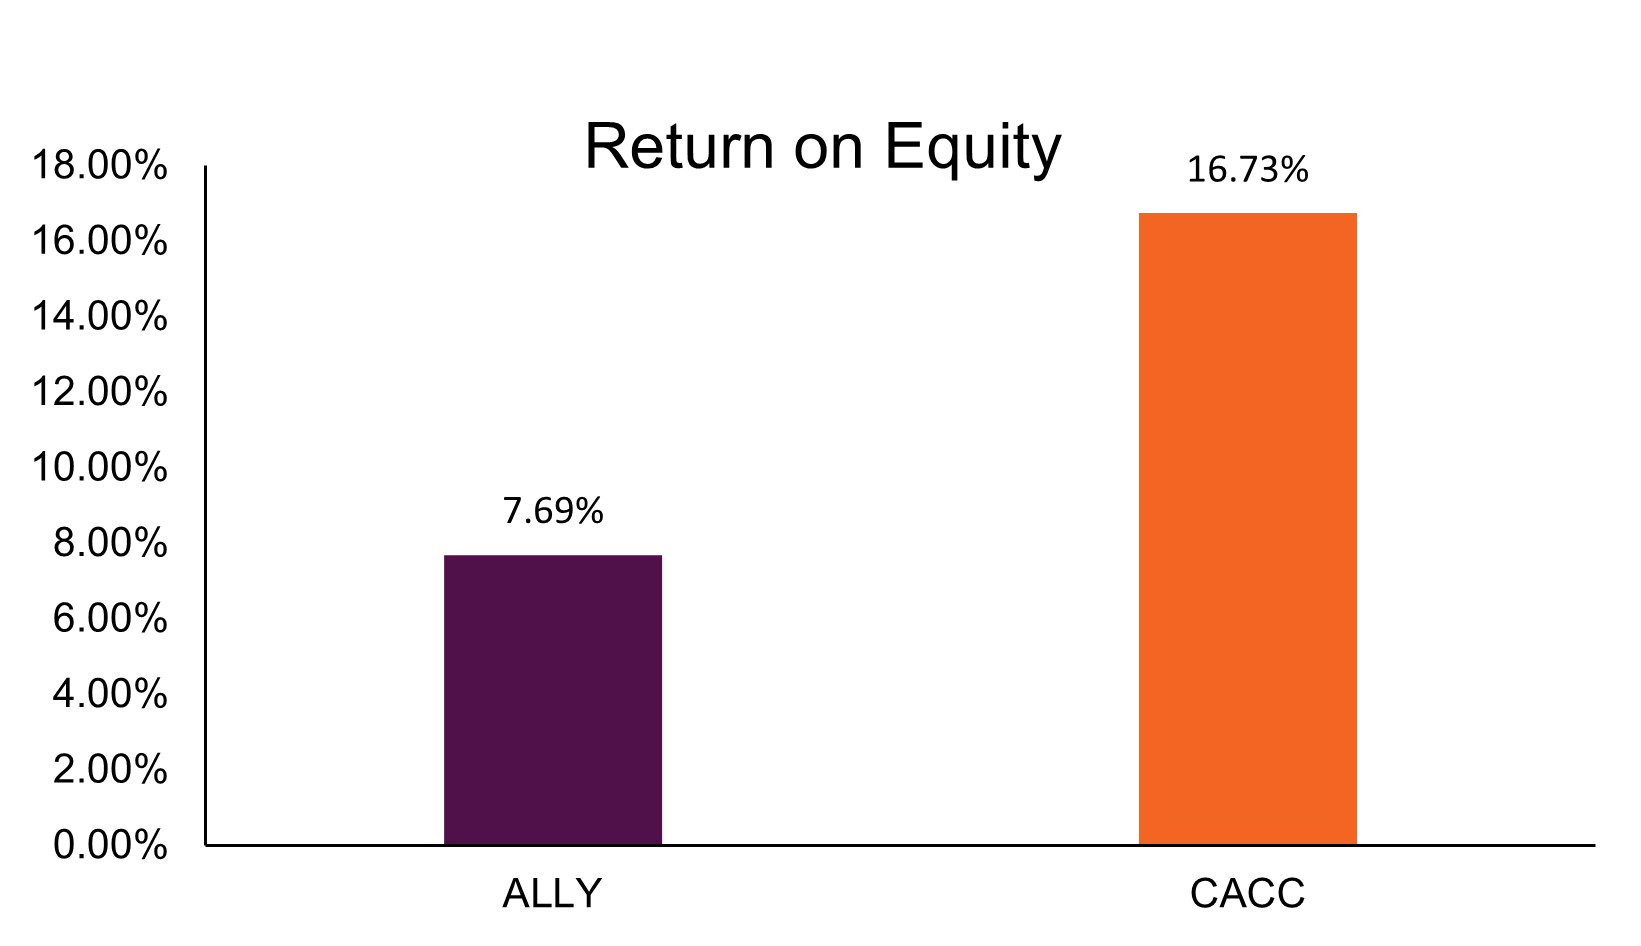
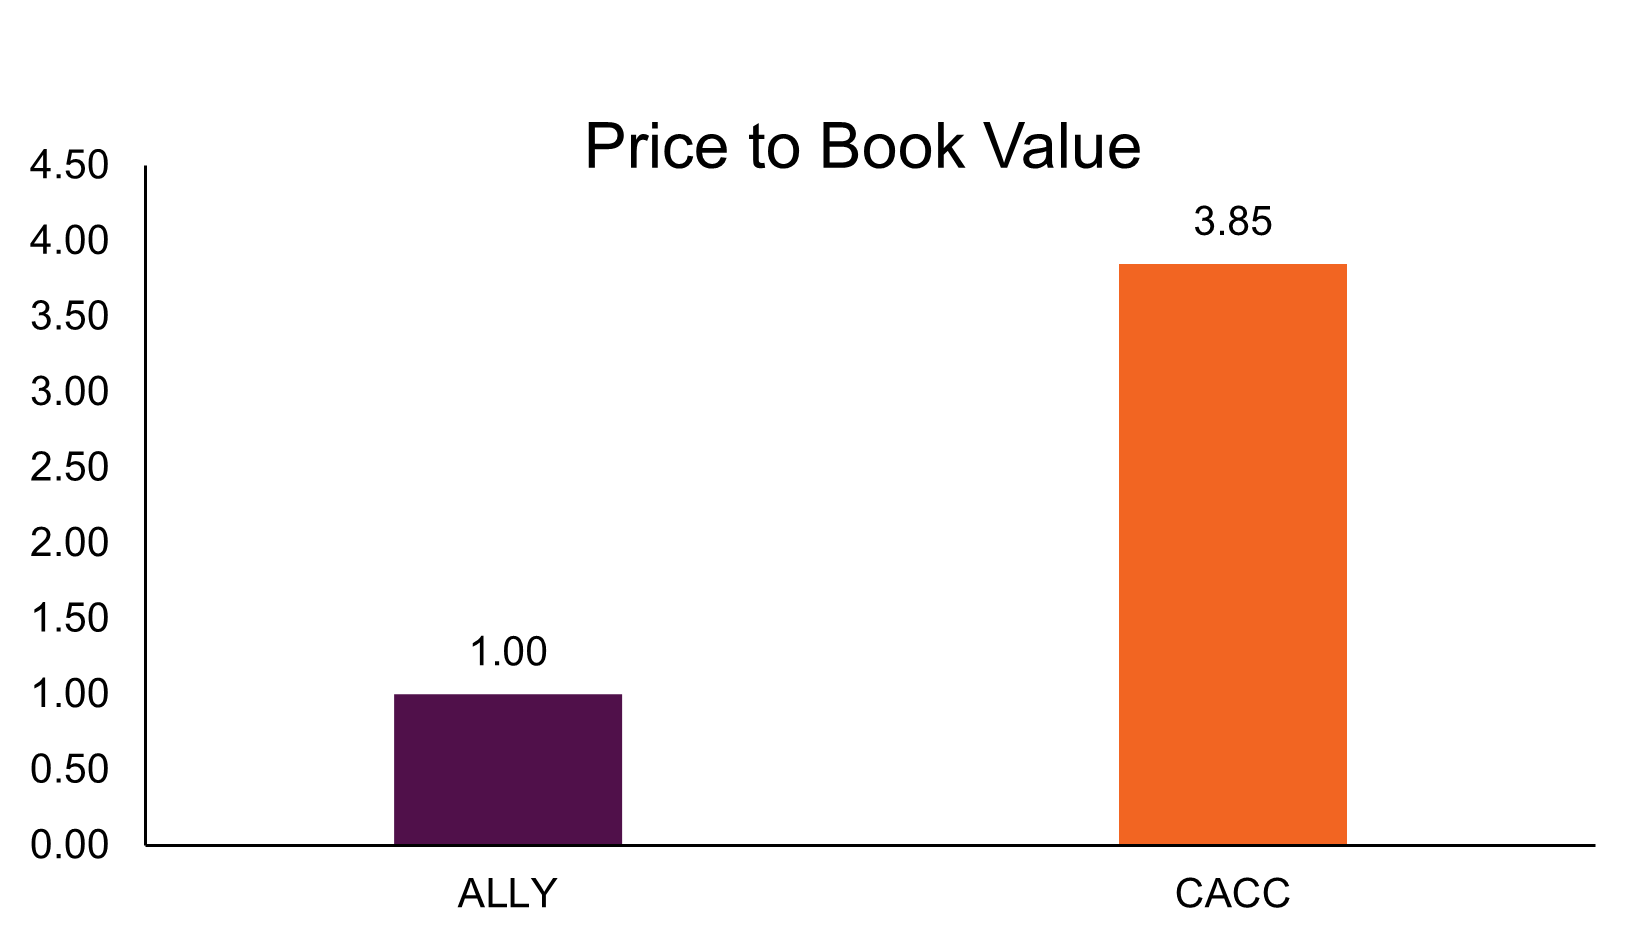
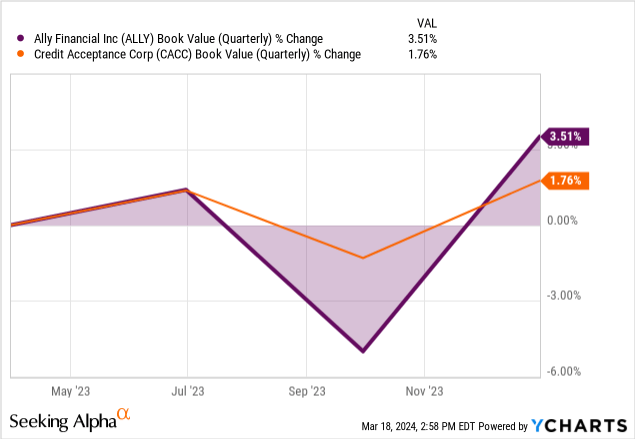
I would like to do the comparison based on the three metrics above.
Seeking Alpha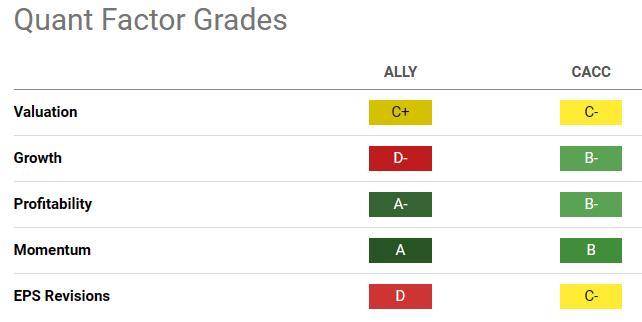
Checking Seeking Alpha's quant ratings, Ally does better than CACC in all aspects but growth and EPS revisions. The latter just by a small difference, and it's also prudent to point out that Ally has been covered way more than CACC by Wall Street analysts in the last three months. 21 analysts vs. 3 analysts, so quite a difference. Now diving into the growth rating, CACC honestly did do better than Ally, but it was mainly a 2023 thing where Ally had terrible NII growth of -10.65%, while CACC only had a small fall of -2.03%. However, if you have a look at the previous years, Ally significantly displayed higher growth numbers.
Therefore, based on quant ratings and commonly used valuation ratios for banks, I believe that Ally has a superior valuation compared to CACC.
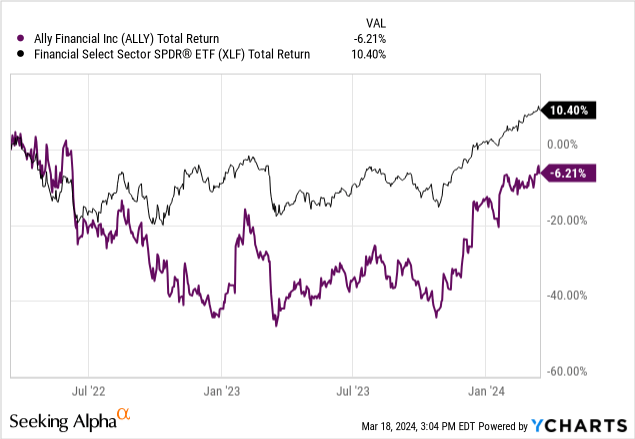
Now let's compare Ally's performance against the Financial Sector ETF (XLF). The outcome significantly varies based on the look back period analyzed. For example, the stock has underperformed its natural benchmark by -16.6% since the start of rate hikes. Nonetheless, for the last year the stock has outperformed the financials ETF by 41.1% and by 16.9% over the last 6 months from a total return perspective.
Ally | XLF | Difference | |
6M | 34.6% | 17.7% | 16.9% |
1Y | 70.0% | 28.9% | 41.1% |
Rate Hikes Start | -6.2% | 10.4% | -16.6% |
(Source: Author's compilations| Data: YCharts)
In the end, even though the regime period has affected the company to obtain better financial returns, they are operating at a cyclical business and the rate hikes have truly affected them. All metrics such as, efficiency ratio, net interest income & margin, and provisions to revenue are lying on the red side since this monetary policy regime started. Fortunately, the hikes seem to be over as the Fed has maintained the rates on the same level since September of 2023. And yes! there are discussions on whether they would start cutting rates earlier or later in the year, whether it would be three or six rates, but in the end, what is true is that we are getting closer for that scenario happening unless things unfold, of course. That said, cheaper financing would help induce car loan issuance, especially for customers with high credit scores.
Seeking Alpha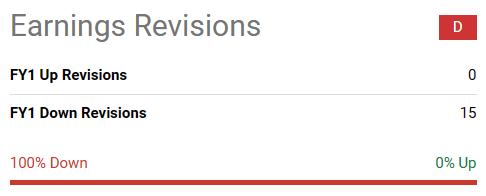
One important aspect that caught my attention was the poor earnings revision that this company has. For the fiscal year of 2024, 15 revisions have been conducted, and all to the downside. However, this is probably an industry matter as CACC also has a mediocre earnings revision rating.
(Source: Author's editing | Data: Seeking Alpha)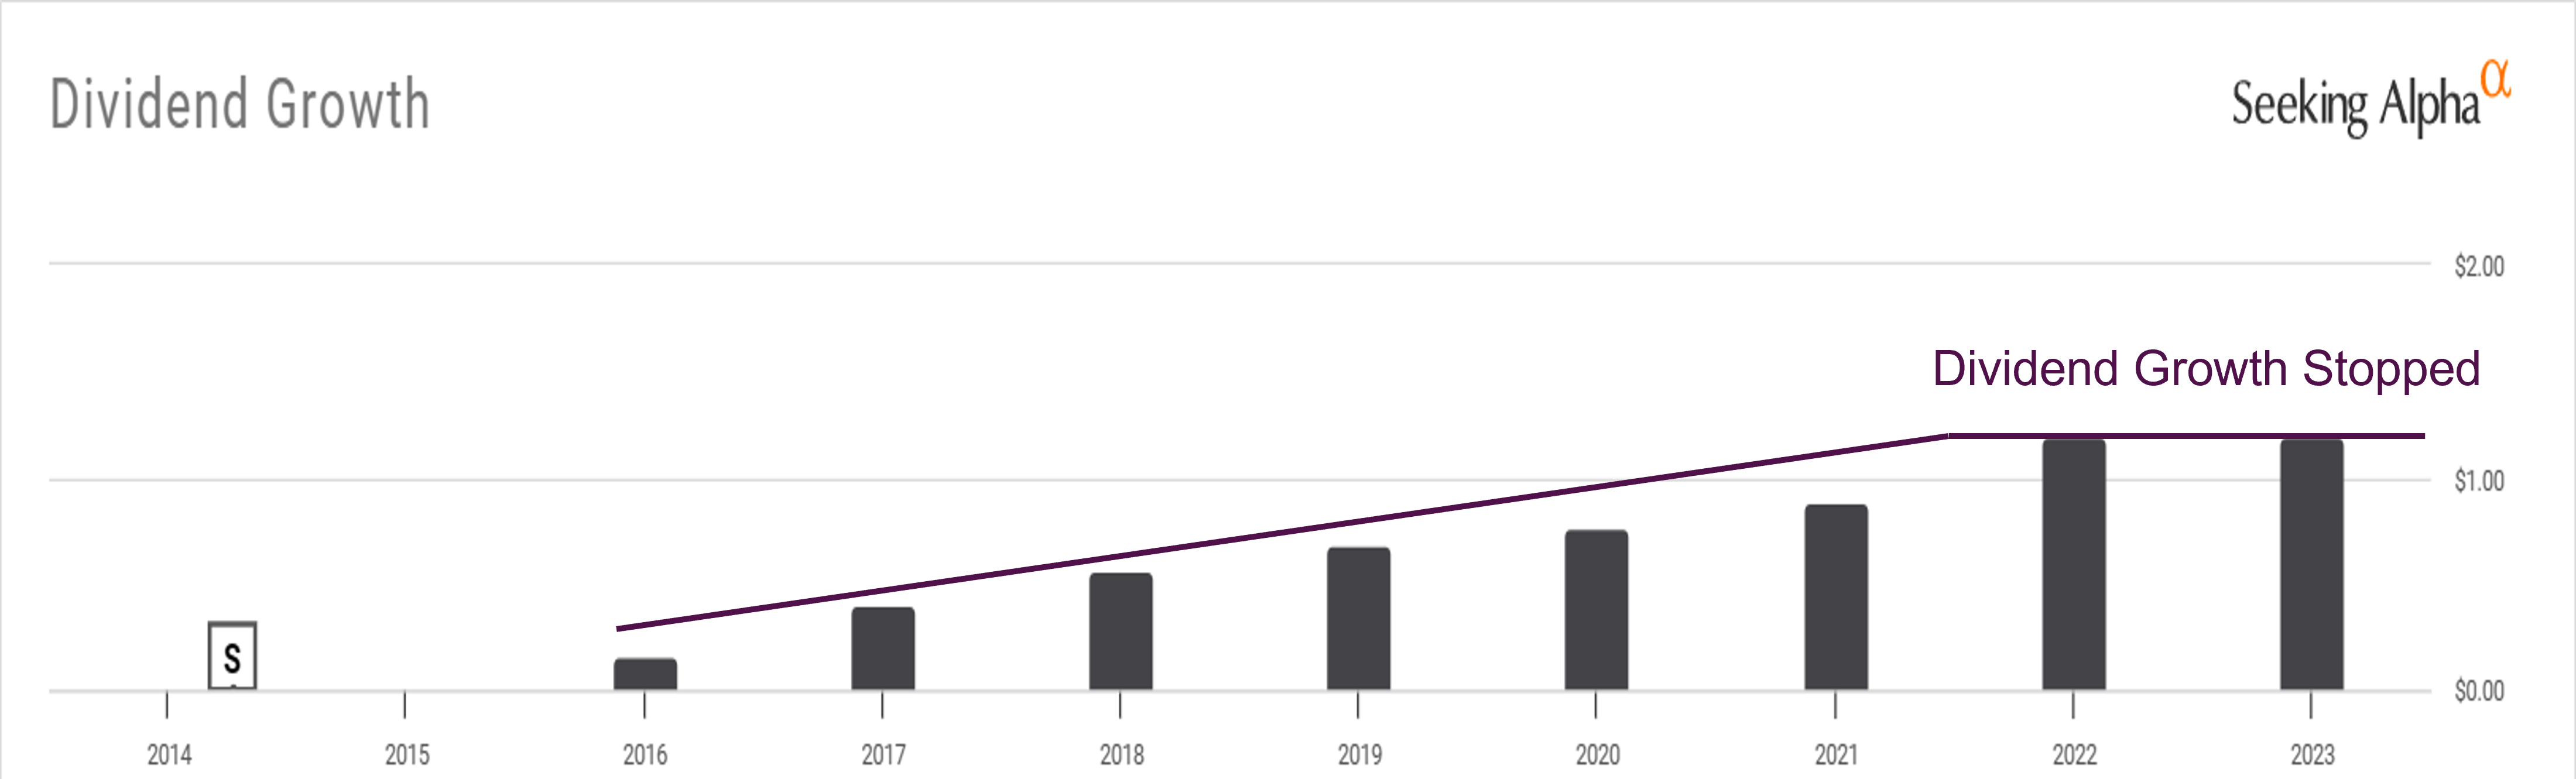
Ally has implemented great corporate actions for investors like spending $3.46 billion in share repurchasing since June 2021, and being able to diversify its financing sources to more stable ones such as retail deposits. Despite dividend growth increasing every year since 2016, in 2023, the increase stopped due to the macro environment and kept the payout ratio at around 40%. The rate remains sustainable considering Ally has previously distributed at payout rates of 26.41% maximum. But a key risk here lies in the company not being able to increase its net income, which could result in a dividend cut.
Another risk could be a loose monetary policy in response to a weak economic environment. In those terms, the cure of lower interest rates could be worse than the disease, as higher delinquency rates would follow, and consumer propensity to buy nonperishable goods would shrink. Additionally, a high deposit beta with interest rates decreasing could be a matter of concern in terms of funding, as depositors would start saving less, spending more, or simply transferring their assets to other banks.
In investing you want to use your telescope and anticipate events. This is why I have a buy rating on this cyclical company. Yes, the financial results are weak, mainly due to the macro environment. But my bet is that the rate hikes are over, and any Fed action to reduce the rates would be a win, no matter if they do it in June or months later. If a lower deposit beta on the way down ends up materializing, that company could continue to enjoy their acquired funding profile and get higher net interest margin deals. Even more, with that many people with good credit not finding attractive to get a car loan with the existent loan rates.