
Sakorn Sukkasemsakorn
Sakorn Sukkasemsakorn
Written by Nick Ackerman.
One of the exercises that I like to do is our regular monthly screening article to look for potential ideas. This helps to narrow down a vast list of companies that are available to buy stocks into a more manageable and targeted approach meeting specific criteria.
As a dividend investor, I am quite biased in running screens based on various metrics that pertain specifically to dividend metrics. For the regular monthly screening piece that I put together, one of the criteria is sorting by highest yield. I do love a good high yield, but that's not the only thing I'm focused on when it comes to the dividend growth side of my portfolio.
Today, I wanted to take a look at some dividend contenders. These are companies that have raised their dividends between 10 and 24 years. That makes these companies that have shown a consistent dedication to growing dividends for investors. They could even be upcoming dividend aristocrats or kings in the future, should they keep their streaks alive.
Not always, but sometimes, these are companies that tend to have more growth potential. In fact, it is one of the criteria that will be selected below is having higher dividend growth. Some of these companies may not have even been around for 50 years to meet dividend king status or dividend aristocrat status by achieving 25 years of dividend raises.
With that being said, here was the process of whittling down the universe of stocks using the Portfolio Insight screening tool. Like any screening process, this is simply a starting look for something that may be a good fit for a portfolio. There will always need to be much more due diligence to see if something is worth investing in or not. These are also all my own personal opinions; what could be interesting to me might not be a good fit or interesting to someone else.
First was selecting those that meet the dividend contenders' status of between 10 and 24 years of annual dividend increases. By selecting that metric, we moved down to 374 names.
Second, we are looking at those names that have not only been rising for at least 10 years but also meet the relatively high hurdle of a minimum 10% compound annual growth rate. These should be companies that aren't slipping by due to being able to just raise by a penny. I believe that will help eliminate some companies that are fairly stagnant in terms of their growth potential - at least historically. With that move, we actually still get 203 names. Which I felt was rather impressive.
A third criterion selected to make the list even more stringent and find some of the best of the best was to look at payout ratios. In this case, I've selected that a company needs to have a dividend payout ratio in the last 5 years of less than 30%. This should represent companies that leave plenty of capacity for growing the dividend in the future. However, not only plenty of cushion in terms of dividend coverage, but that should allow plenty of profit/cash left for a company to still grow at a healthy pace moving forward. With this selected, we've moved down to 45 names left.
From there, I added one more metric: the P/E ratio has to be less than 15x. That should indicate that the valuation of these companies isn't too extreme. It isn't a great metric on its own, as there are many factors when it comes to determining valuations and whether a company is at a good value or not. That said, it did get us down to 25 names, which, on that front, worked out well.
Fortunately, Portfolio Insight also allows for its own fair value metrics as well to determine if something is looking pricey or not. This is listed in the below chart as "Fair Value O/U."
| Ticker | Company | Fair Value O/U | Trailing Total Returns (10Y) | Trailing Total Returns (5Y) | Trailing Total Returns (3Y) | 10Y Dividend Growth (TTM) | Non-GAAP P/E |
| (AFG) | American Financial Group, Inc. | -20.31% | 14.19 | 14.95 | 23.52 | 12.44% | 11.26 |
| (AGCO) | AGCO Corporation | -43.65% | 9.54 | 20.34 | 10.17 | 10.75% | 7.81 |
| (AIZ) | Assurant, Inc. | -36.67% | 12.01 | 15.75 | 9.35 | 11.38% | 10.88 |
| (AL) | Air Lease Corporation | -14.72% | 4.34 | 8.75 | -0.08 | 22.67% | 6.52 |
| (ALL) | The Allstate Corporation | -2.22% | 12.29 | 13.9 | 11.41 | 13.54% | -139.79 |
| (AMP) | Ameriprise Financial, Inc. | -2.87% | 15.26 | 32.19 | 27.14 | 10.18% | 13.16 |
| (BC) | Brunswick Corporation | -16.18% | 9.26 | 17.76 | 10.11 | 31.95% | 10.99 |
| (CIVB) | Civista Bancshares, Inc. | -30.12% | 13.39 | 3.87 | 4.61 | 15.06% | 8.47 |
| (CNO) | CNO Financial Group, Inc. | -11.2% | 6.85 | 16.27 | 10.48 | 18.29% | 9.03 |
| (DDS) | Dillard's, Inc. | 26.27% | 17.56 | 51.42 | 95.19 | 15.13% | 7.76 |
| (ELV) | Elevance Health, Inc. | -17.02% | 19.35 | 13.78 | 15.02 | 14.72% | 14.23 |
| (FSBW) | FS Bancorp, Inc. | -29.86% | 17.69 | 13.98 | 13.39 | 29.57% | 7.31 |
| (HIG) | The Hartford Financial Services Group, Inc. | -6.25% | 10.67 | 15.34 | 20.7 | 13.31% | 9.05 |
| (LAD) | Lithia Motors, Inc. | -24.76% | 17.85 | 34.93 | 4.61 | 17.28% | 4.61 |
| (MCK) | McKesson Corporation | 44.32% | 12 | 34.35 | 39.56 | 10.18% | 13.73 |
| (NNI) | Nelnet, Inc. | 0.49% | 8.94 | 12.36 | 8.63 | 10.24% | 14.76 |
| (PRI) | Primerica, Inc. | -2.47% | 18.4 | 17.62 | 17.04 | 19.44% | 12.4 |
| (RJF) | Raymond James Financial, Inc. | -11.16% | 14 | 19.6 | 22.39 | 16.03% | 12.1 |
| (SBFG) | SB Financial Group, Inc. | -28.02% | 9.7 | 2.2 | -1.42 | 16.36% | 8.77 |
| (SMBC) | Southern Missouri Bancorp, Inc. | -14.22% | 14.14 | 11.55 | 22.73 | 10.48% | 8.32 |
| (TSBK) | Timberland Bancorp, Inc. | -21.76% | 15.82 | 10.89 | 12.86 | 22.59% | 13.18 |
| (UFPI) | Universal Forest Products, Inc. | -1.74% | 23.18 | 38.49 | 32.65 | 23.19% | 7.22 |
| (UNTY) | Unity Bancorp, Inc. | -12.15% | 17.33 | 9.23 | 21.04 | 33.2% | 7.71 |
| (WSFS) | WSFS Financial Corporation | -22.28% | 7.04 | 5.33 | 2.16 | 16.71% | 10.1 |
| (WTFC) | Wintrust Financial Corporation | -19.62% | 8.68 | 8.82 | 16.93 | 24.42% | 9.68 |
This takes the P/E ratio and looks at where it is trading relative to its history. It further takes analyst consensus estimates for its algorithm to determine a fair value price as well. A negative number means it is undervalued, and a positive percentage means it is looking overvalued.
With that, we have a few names that look to be fairly interesting that we can touch on.
AGCO Corporation - AGCO comes in as the most undervalued based on Portfolio Insight's fair value estimate. Their algorithm suggests that a 1-year price target is $209.34, which would suggest an upside of 71%. The fair value estimate is actually a bit higher and comes to $216.84. As of writing this, shares are actually sliding after the company just missed estimates.
AGCO Fair Value Range (Portfolio Insight)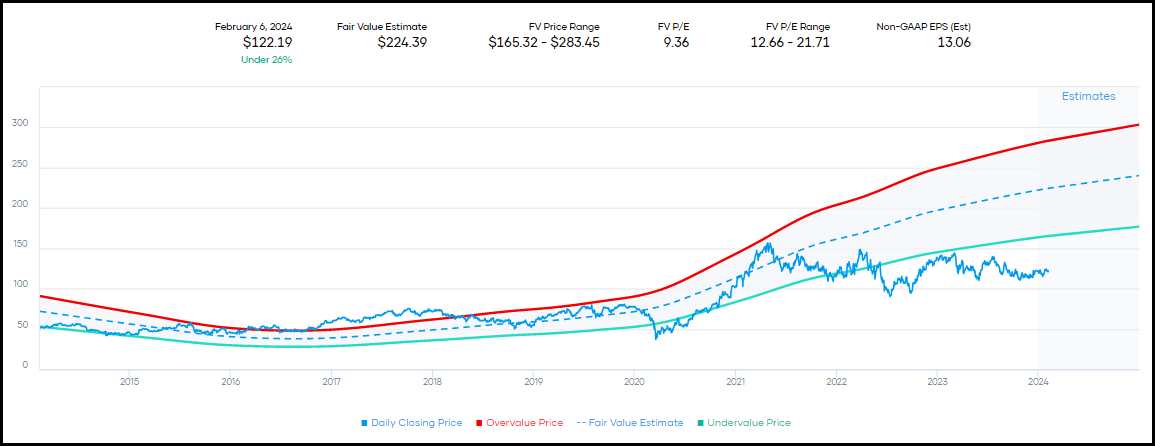
Interestingly, this is a company that has been moving sideways in terms of its share price after a rapid climb out of the Covid pandemic lows. The company is more cyclically as it "manufactures and distributes agricultural equipment and related replacement parts worldwide." That puts it in the industrial category, which is sensitive to economic conditions.
After several years of earnings rocketing higher, analysts are expecting some downside in the years ahead. For their own 2024 guidance, they expected EPS to come in at $13.15. That's topping the $13.06 estimated by analysts.
AGCO Earnings History And Estimates (Seeking Alpha)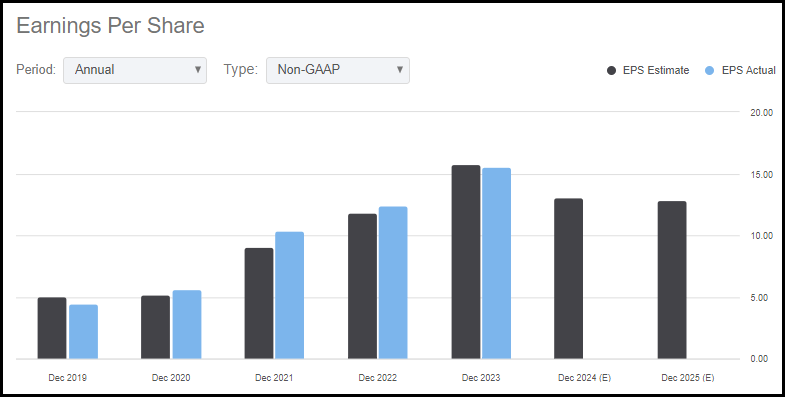
That certainly doesn't bode well, but even the forward P/E ratio never goes higher than 10x, even with the anticipated earnings hit next year. Further, the company meets the dividend contender moniker due to its 10 years of raising dividends. There were even a few very large specials thrown in there the last few years while earnings were booming. This is something that I like to see because management is well aware of their business cyclicality, and I believe it bodes well for the outlook of the regular dividend.
You can always cut back on specials, but when you start cutting the regular, then investors can flee. The dividend payout for the regular comes to just 8.88%, too. That's based on the $1.16 payout and earnings estimate of $13.06 for next year. That is leaving plenty of cushion for earnings to fall back even if things get uglier in the economy.
AGCO Dividend History (Seeking Alpha)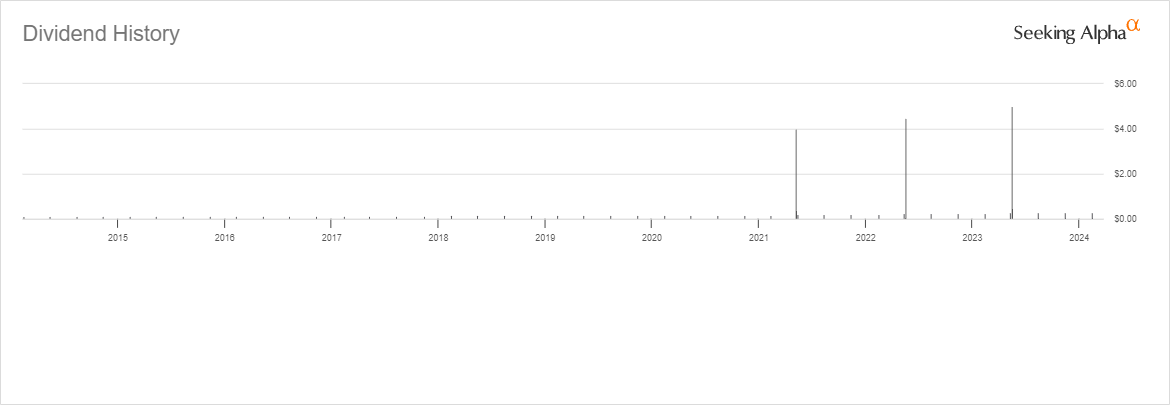
Assurant Inc - AIZ is another name that looks to be trading below its fair value estimate by a fairly wide margin. In this case, the fair value estimate comes to $266.68, but the 1-year target is a bit higher at $279.88 for a potential 66% upside from here.
AIZ Fair Value Range (Portfolio Insight)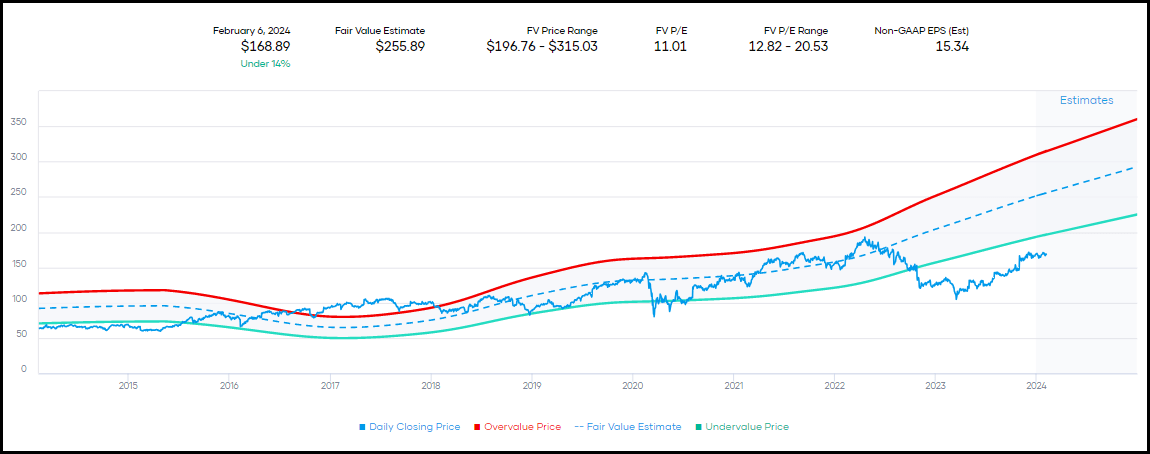
Assurant is a financial company listed in the multi-line insurance industry. They describe themselves as a "leading global provider of comprehensive risk management solutions for the auto, lifestyle, and housing protection sectors."
Similar to AGCO, they looked to see some explosive earnings growth over the last few years. Despite this, the growth has come to a halt, and analysts expect to see a slight drop in EPS next year. However, that is followed by another year in 2025 where analysts expect to see earnings growth once again.
AIZ Earnings Growth And Estimates (Seeking Alpha)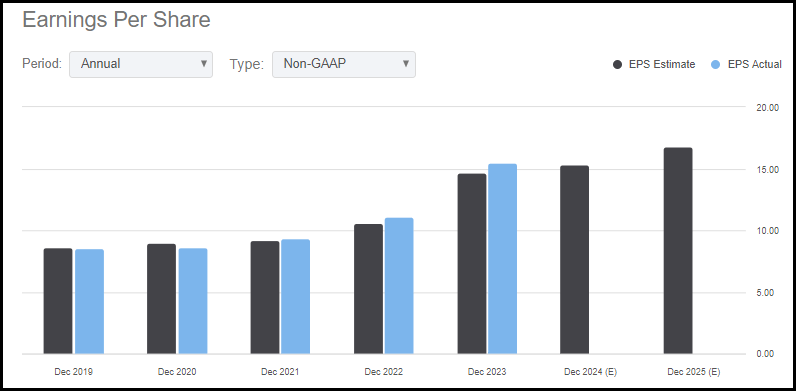
The company has been able to deliver a growing dividend for 19 years, which includes the Global Financial Crisis and during COVID-19. However, it appears to be one quite large raise in 2014 that really bumped up the annualized growth rate of the dividend. The last 5 years still come at a respectable 9.2% CAGR, with the last 3 coming in at 11.55%. Given the payout ratio of less than 19%, we have a lot of room here, making the dividend look quite safe.
AIZ Dividend History (Seeking Alpha)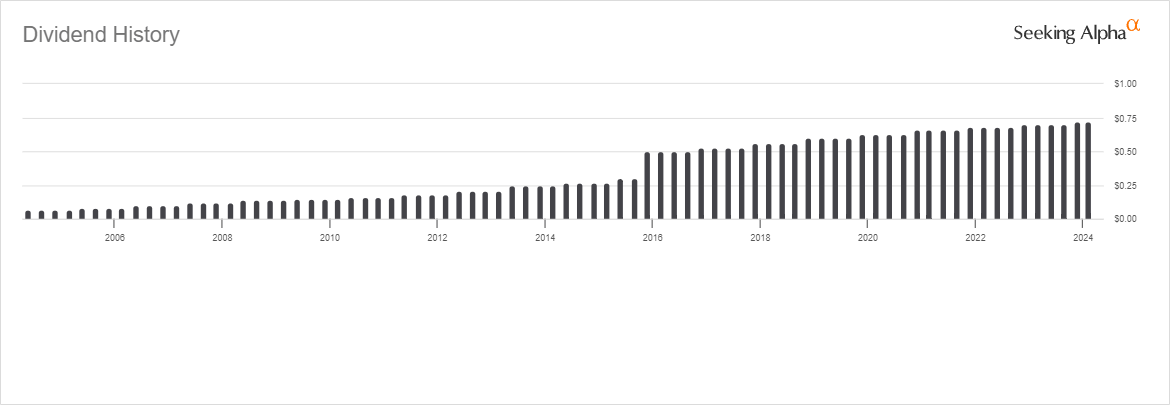
Another name worth taking a quick look at isn't one that is trading at a discount to fair value as deep as the above. Though, it is still considered to be trading at a fairly attractive valuation nonetheless. That is Elevance Health, ELV, which is suggested to be about 17% under fair value, according to Portfolio Insight. They have a fair value estimate of $595.09 with a 1-year price target of $625.09, suggesting a 27% 1-year upside. This puts it relatively close to its historical fair value range.
ELV Fair Value Range (Portfolio Insight)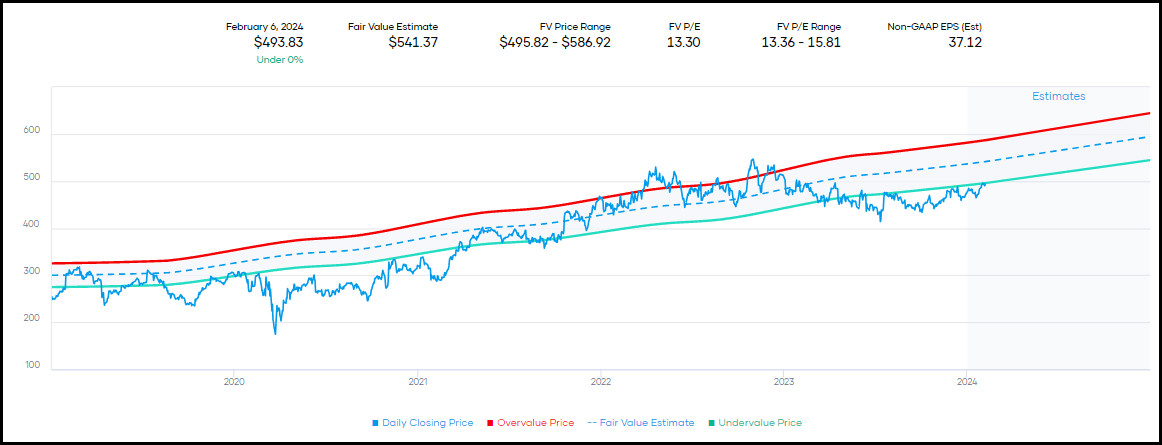
This one catches more of my attention because, unlike the other two currently looking the most undervalued, this one is actually projecting earnings growth going forward. In fact, it's looking like if analysts are right, there will be some pretty good earnings growth in the next few years.
ELV Earnings Estimates (Seeking Alpha)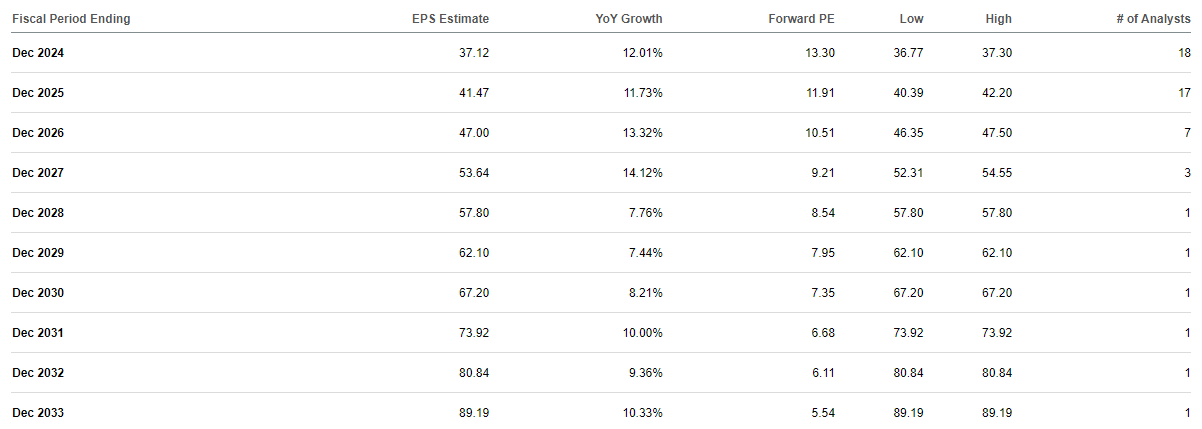
Further, as an investor in UnitedHealth Group (UNH), as my managed healthcare play, ELV is actually looking like the better value these days. UNH is significantly larger, but we see a decent forward P/E ratio for ELV with a modest PEG ratio as well. UNH is expected to grow faster in terms of revenue and EBITDA, but EPS growth is expected to be somewhat similar moving forward.
ELV Vs. UNH Valuation (Seeking Alpha)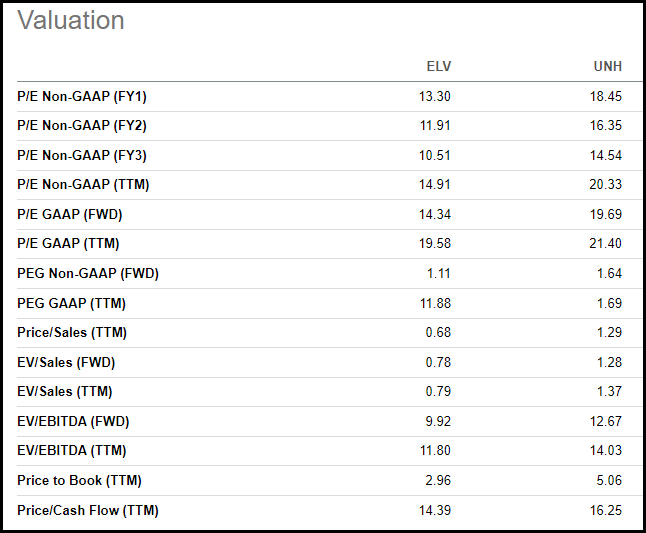
I don't plan to sell my UNH position, but it is certainly something to consider if investors are looking to put some capital to work in the healthcare insurance industry.
ELV has been growing its dividend for 12 years, with dividend growth that's been fairly consistent in the 14 to 16% range. The latest annualized dividend comes to $6.52, and against the $37.12 in estimated earnings, it puts the dividend payout ratio at only around 17.5%.
ELV Dividend History (Seeking Alpha)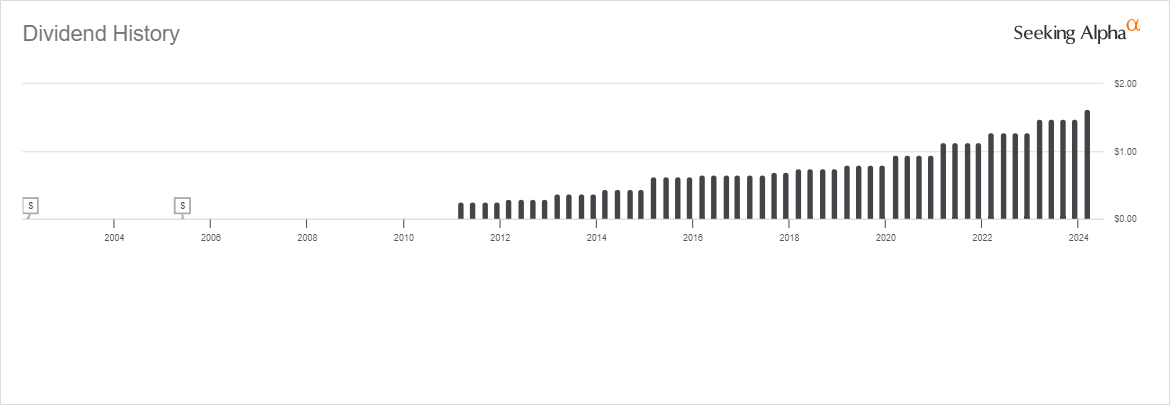
For some further comparisons with UNH, UNH has 14 years of dividend growth. They have been pretty aggressive in terms of growing their dividend, too. The 10-year CAGR of 21.35% beats out ELV, but it has been slowing in the 14 to 16% CAGR range as well more recently.
That could make either ELV or UNH a dividend growth investor dream play with expectations that they can maintain some healthy growth going forward. However, it does appear that ELV is the better value these days for investors putting capital to work if it comes down to the choice between these two.