
andresr
andresr
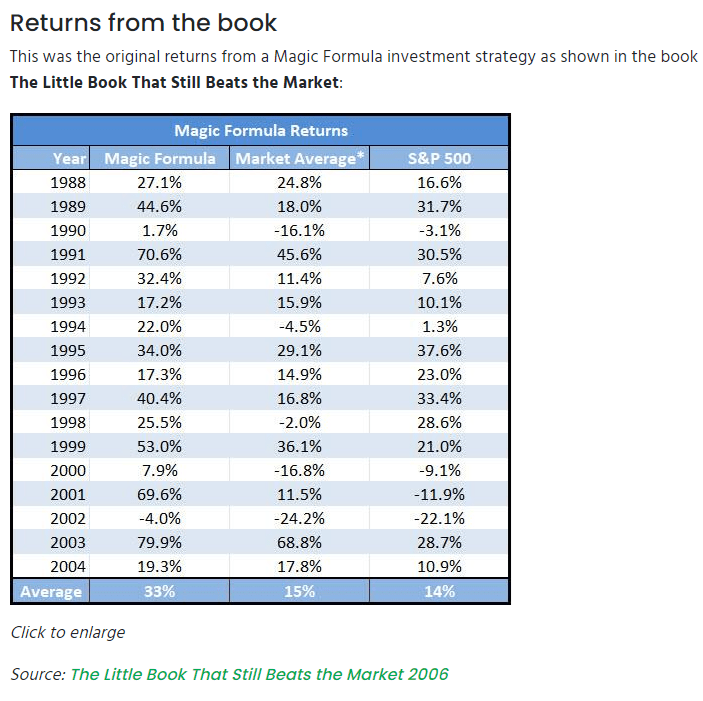
Last week, I showed you a rules-based approach using Joel Greenblatt's Magic formula as an example.
Quant Investing
The critical elements of Greenblatt's magic formula are:
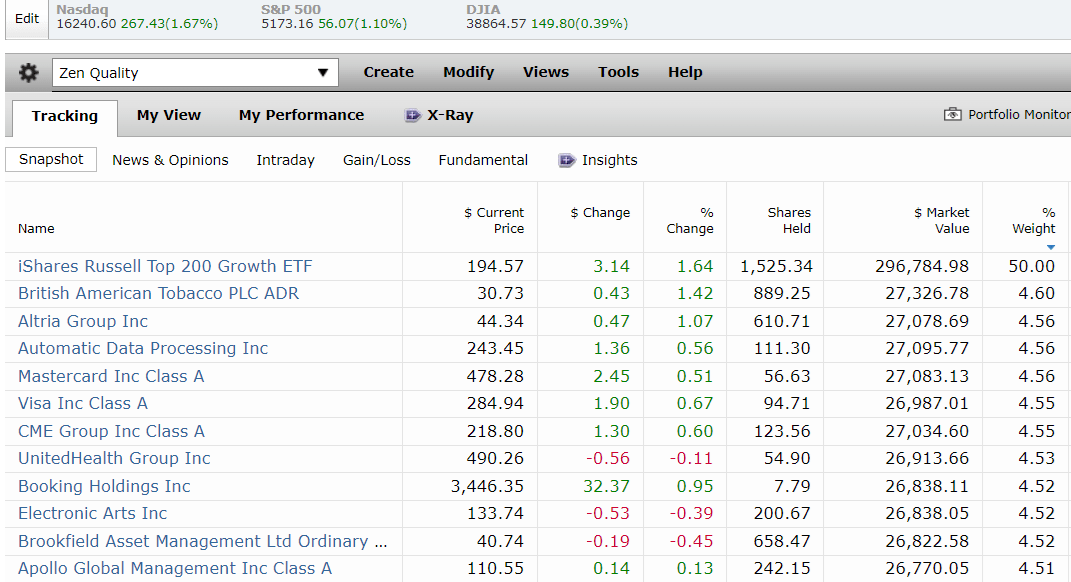
Let me show you how we're using these elements for our Zen Quality Portfolio during this year's rebalancing.
Sharesight
The Zen portfolio strategy uses 50% ETFs that target your goal (yield, growth, value, quality, low volatility, etc.). The other 50% go into the best individual stocks matching those goals.
Wall Street's favorite quality metric is profitability. For Joel Greenblatt, that meant return on capital, which he defined as the pre-tax profit divided by the money it takes to run the company for a year.
Unfortunately, it's impossible to screen ETFs based on ROC; at least, I haven't found such a screener. However, we can screen based on return on invested capital and free cash flow margin.
Let's consider the ProShares S&P 500 Dividend Aristocrats ETF (NOBL), the core ETF for the Zen Quality portfolio.
NOBL is considered by many to be a gold-standard quality ETF because it's the official S&P dividend aristocrat ETF.
Ben Graham, founder of fundamental analysis and valuation and Buffett's mentor, considered 20 years without a dividend cut an important sign of quality.
So, 25 years of continuous dividend growth through recessions, crises, and all manner of inflation and interest rate environments is a strong sign of quality, or at least dependability.
Morningstar estimates 88% of NOBL has a moat, and the ETF ROIC is 14% with 24% free cash flow margins.
But look at how that compares to other high-quality ETFs.
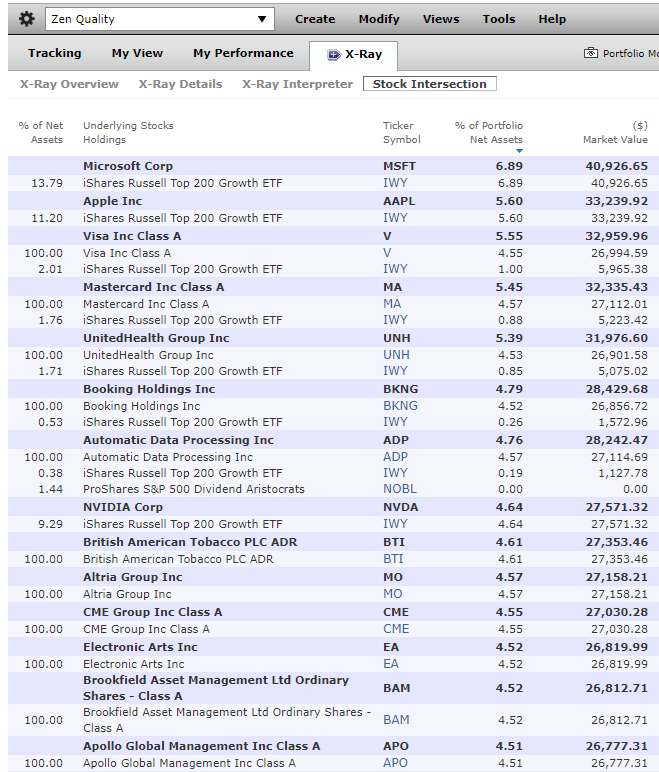
If you define quality as Wall Street does, by profitability, then it's hard to beat IWY as the quintessential quality ETF. IWY's profit metrics are superior to even quality ETFs like QUAL.
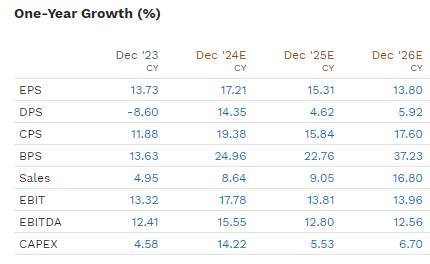
And you get some truly exceptional 15% long-term growth consensus estimates (bottom-up) from Morningstar's analysts.
FactSet Research Terminal
OK, so IWY is one of the highest-quality ETFs based on profitability. But what about the 50% stock bucket?
Where can we find companies with quality trading at reasonable prices?
It's far better to buy wonderful companies at fair prices than fair companies at wonderful prices" - Warren Buffett
Warren Buffett started his career cigar-butt investing searching for $1 in value he could buy for $0.50.
However, he made nearly all his fortune after meeting Charlie Munger, who became his right hand for decades at Berkshire (BRK.A) (BRK.B) and taught him that buying $1 in value for $1 that's growing at 10%, 15%, or even 20% is the better strategy.
Think of it like this. If you buy $1 for $0.50, you double your money if the company returns to fair value.
But what if the company traded at a 50% discount because it had no growth? Or even negative growth? Then, the best you can hope for in the long term is 100% gains.
However, a company growing at 10%, 15%, and 20% will double in approximately seven, five, and 3.5 years, respectively.
One of our members came up with an idea for a metric that combines the quality factor of Greenblatt with the growth at a reasonable price or the GARP principle of Peter Lynch.
ROC/PEG.
We then enhanced that using EV/FCF instead of PE in the PEG component.
Pacer
Enterprise Value = market cap + debt - cash, the true cost of acquiring the company.
Buffett calls FCF "owner earnings," the money that can be extracted from a company without hindering its long-term growth or moatiness.
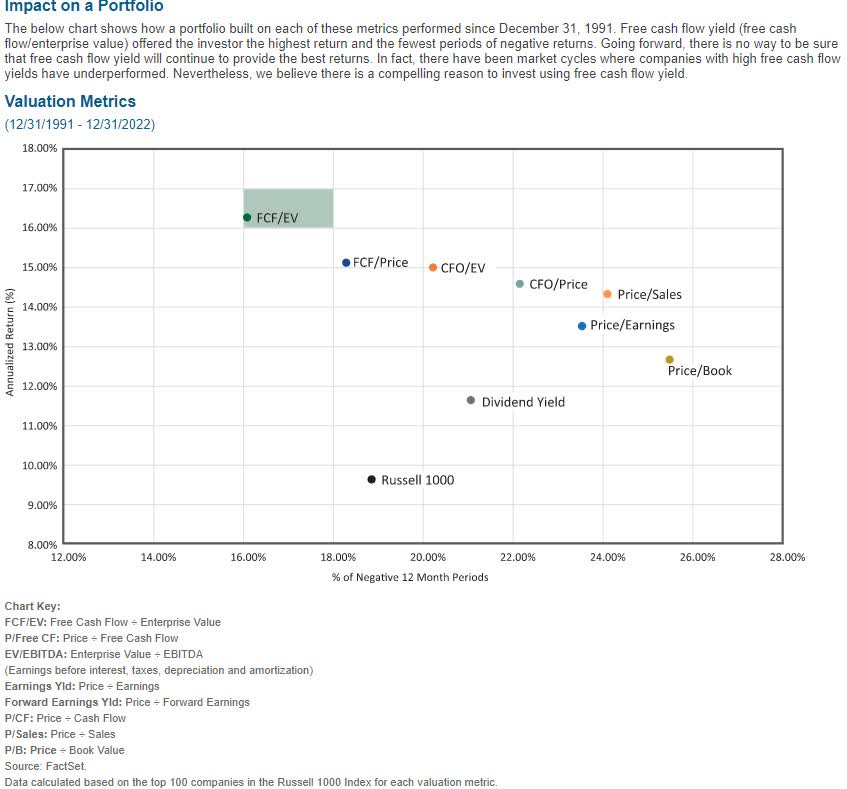
EV/FCF has been the best-performing valuation metric for the last 33 years. A portfolio built around this metric generated average annual gains of 16% with 16% annual volatility, a Sharp ratio of 1.
In contrast, the Russell 1000, the 1000 largest US companies, had 9.5% average returns, 19% annual volatility, and a Sharpe Ratio of 0.5.
In other words, EV/FCF screening resulted in a deep value portfolio that was so potent that it doubled the volatility-adjusted returns of the US market for 33 years.
The chance that any strategy can outperform the market for 33 years, much less by 2X for a third of a century, purely from luck, is approximately 3%.
So that's why EV/FCF is such a great value metric and why COWZ and VFLO and several other value ETFs are now using it to pretty good success.
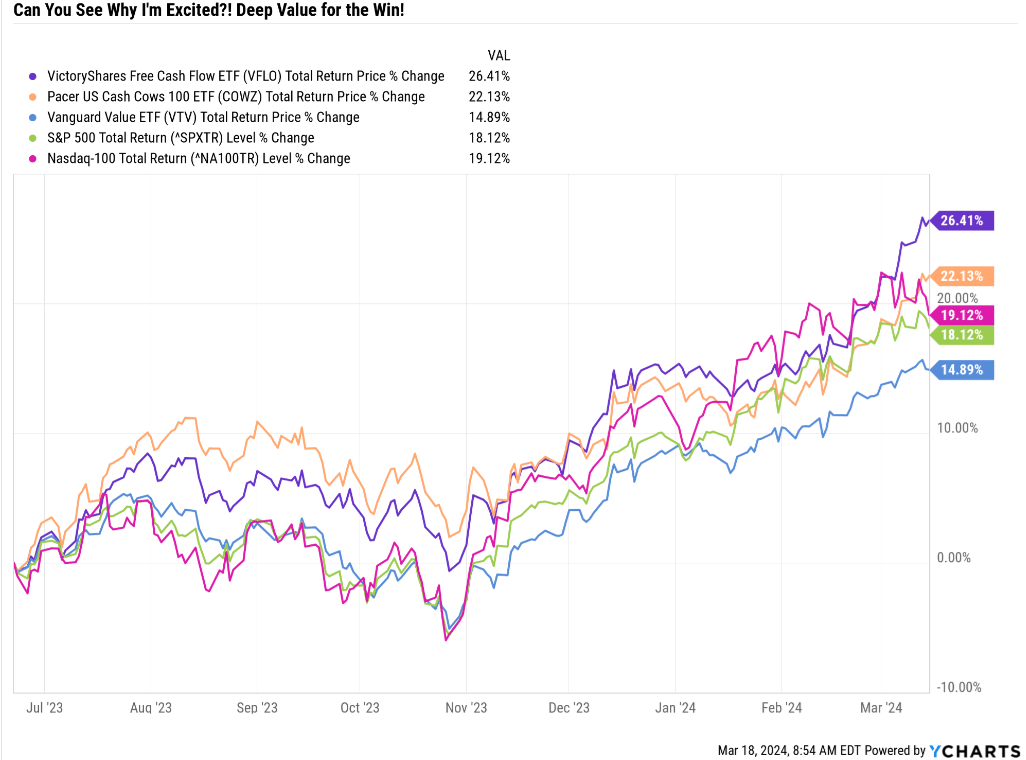
YCharts
Since VFLO's inception in June of 2023, it and COWZ have outperformed the Mag 7 levitated S&P and even the highly Mag 7 concentrated Nasdaq.
Value has underperformed growth... what else is new?
Deep value, based on the best valuation metric, has beaten growth.
Imagine taking EV/FCF and dividing it by growth, creating a super potent GARP indicator.
And now imagine taking Greenblatt's ROC, his gold standard for quality and moatiness, and using the 13-year median to smooth out volatility in any given year.
And what if you divide ROC by EV/FCF/Growth (ROC over GARP)?
Then, you get a measure of return on capital per unit of PEG.
Quality, growth, and value. And not just any measure of quality, growth, and value.
The quality metric Joel Greenblatt favors quality the most.
A PEG ratio (created by Peter Lynch, 30% annual returns for 13 years at Fidelity Magellan) was based on the single most effective valuation metric of the last 33 years.
Can you see how this single number could be so powerful? Why could a rules-based annual rebalancing strategy combining the highest quality (best profitability) ETF + the best ROC/PEG blue chips potentially generate superior returns?
So, how can we find companies based on Greenblatt ROC/PEG?
| Screening Criteria | Companies Remaining | % Of Master List | |
| 1 | Add " ROC/PEG and 12 months fundamentally justified upside" Under "Columns." | 0.00% | |
| 2 | BHS Rating "reasonable buy, good buy, strong buy, very strong buy, ultra value buy" | 304 | 60.20% |
| 3 | Non-Speculative | 264 | 52.28% |
| 4 | Blue-Chip Quality Or Better(10+ Quality) | 261 | 51.68% |
| 5 | Credit Rating Investment Grade (BBB- or better) | 212 | 41.98% |
| 6 | LT Total Return Potential 10+% | 124 | 24.55% |
| 7 | 0.6% or higher yield | 113 | 22.38% |
| 7 | Sort by ROC/PEG | 0.00% | |
| 8 | select top 11 | 11 | 2.18% |
| Total Time | 2 minutes |
So, what are these incredible companies? And how incredible are they? What happens when we screen for a single super metric that incorporates value, quality, and growth, utilizing decades of optimal valuation data and the strategies of two of the greatest investors in history?
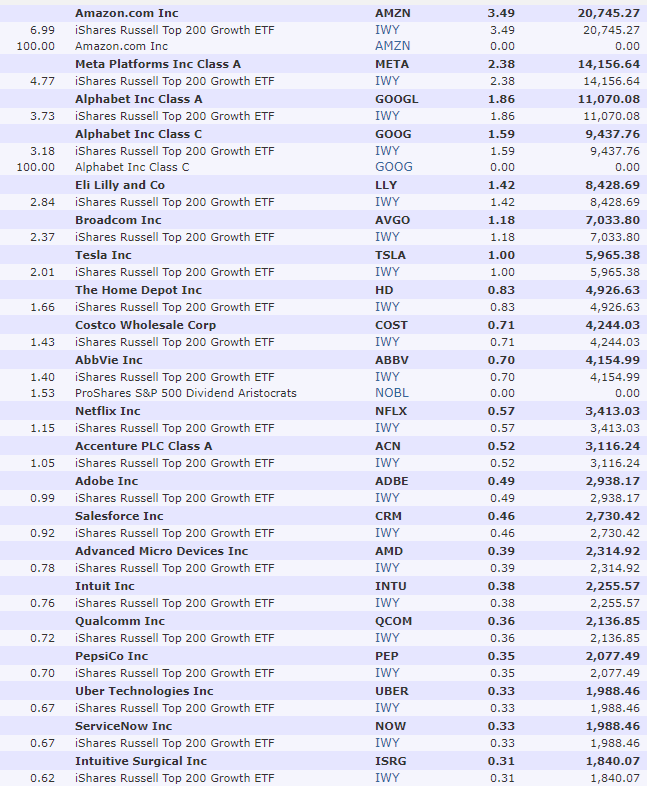
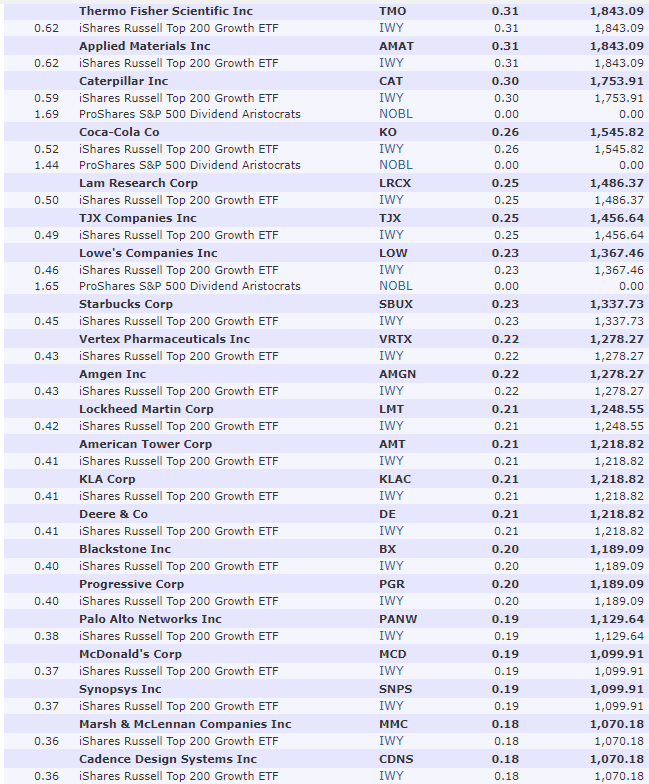
The bottom line is that, upfront, let's summarize the fundamentals of these 11 companies that will make up the 50% stock bucket for this year's ZEN Quality ETF.
The portfolio of 11 ultra-high ROC/PEG companies (range of 121% to 1806%) is very impressive compared to the S&P's 15% and the dividend aristocrats' 25%.
The average ROC/PEG for these 11 companies is 426%, almost 30 times higher than the S&P 500.
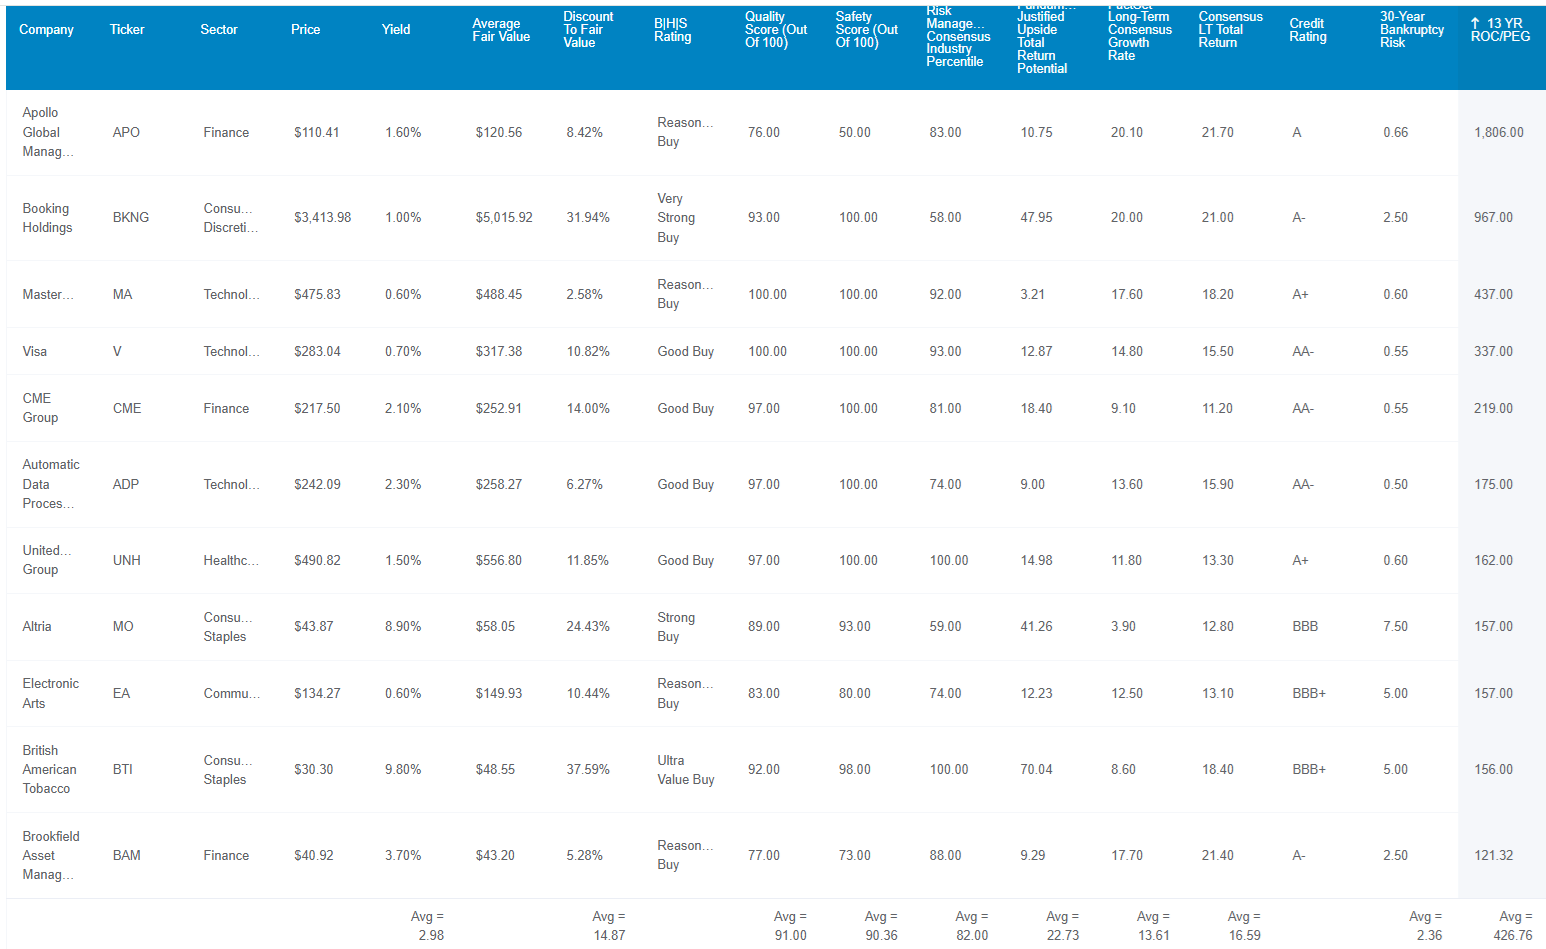
Dividend Kings Zen Research Terminal
The yield is 3%, similar to Vanguard's high-yield ETF (VYM).
The discount to fair value is 15%, so not just quality companies at fair value but wonderful companies at wonderful prices.
Dividend safety is so good that the risk of a dividend cut during another Great Recession or Pandemic level economic crash is approximately 2% (what a 91% safety score means).
82nd percentile long-term risk management means S&P based on over 1,000 risk metrics, thinks these 11 companies have risk management in the top 18% of global companies.
An A-credit rating means a 2.36% 30-year bankruptcy risk.
In the next 12 months, if the companies grow as expected and return to historical fair value, the 12-month fundamentally justified total return potential is 23%.
Morningstar
Morningstar
Morningstar
Morningstar
And here are the fundamentals of the portfolio.
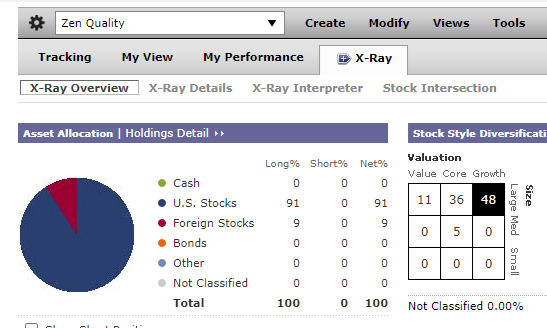
Morningstar
The portfolio is 48% growth, 11% value, and 41% core. In other words, it is more balanced than you might think initially.
Morningstar
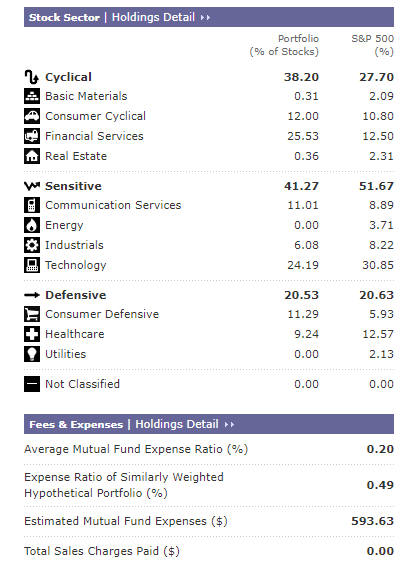
Diversified by sector, with no more than 26% in any single sector, financials is the largest sector.
Morningstar
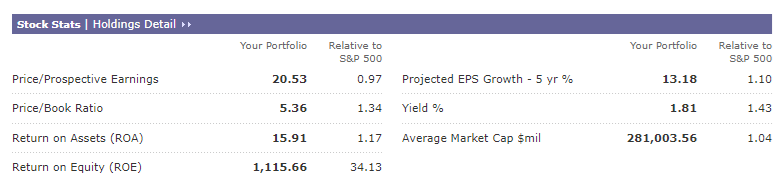
Morningstar's analysts estimate this portfolio is 0% undervalued, in other words, the quintessential "wonderful companies at fair value" at 20.5X earnings.
That gets you companies with more than 1100% return on equity, 34X more than the S&P 500.
Morningstar's analysts estimate a 13.2% five-year EPS growth rate, and the yield on the entire portfolio is 1.8%, 1% more than the Nasdaq and 0.3% more than the S&P.
According to Morningstar, that's a 15.0% long-term return potential for a simple 12-ticker portfolio with excellent profitability (quality).
The past is no guarantee of the future.
However, historical returns can give us an idea of whether current future forecasts are reasonable or at least consistent with what potential portfolios have delivered.
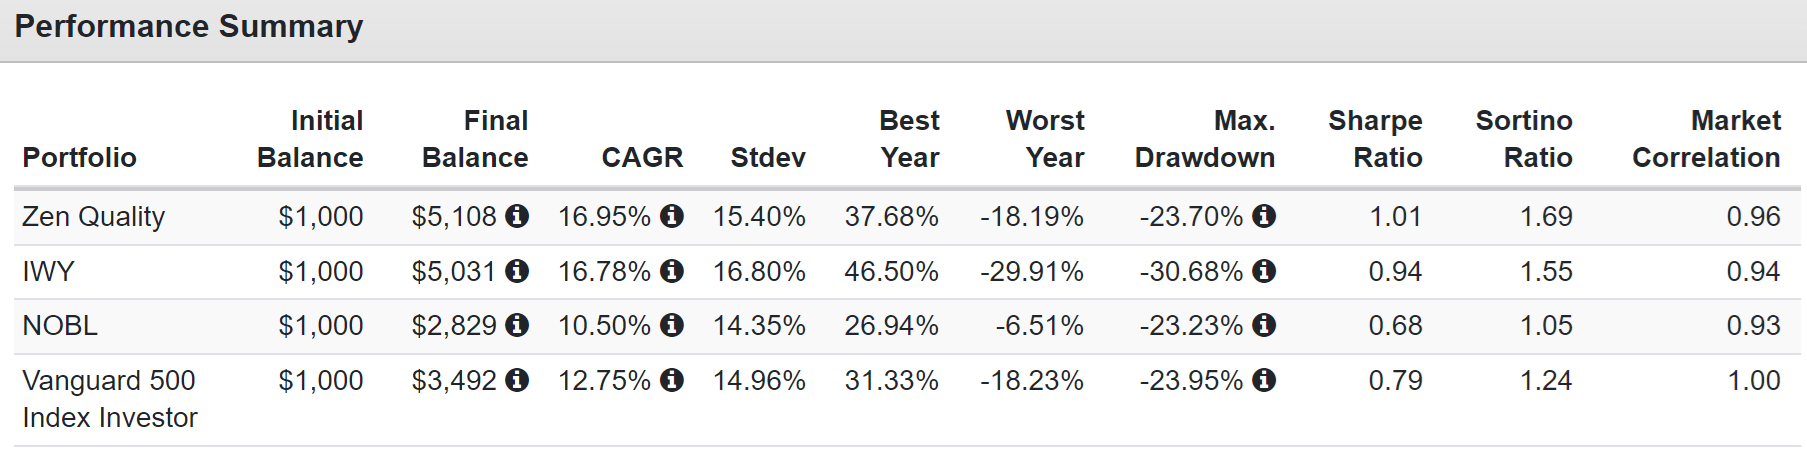
Portfolio Visualizer Premium
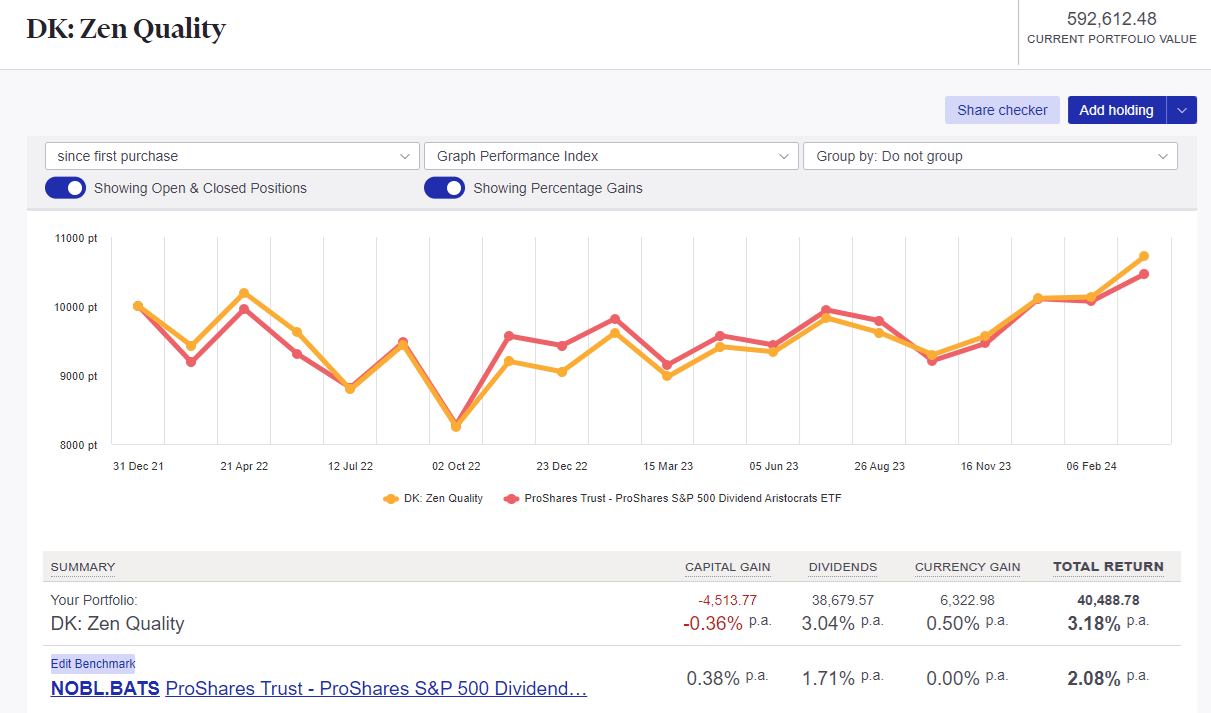
Zen Quality, the complete portfolio, vastly outperformed the dividend aristocrats and the S&P. It even slightly outperformed IWY with lower volatility and a much smaller peak decline in the 2022 bear market.
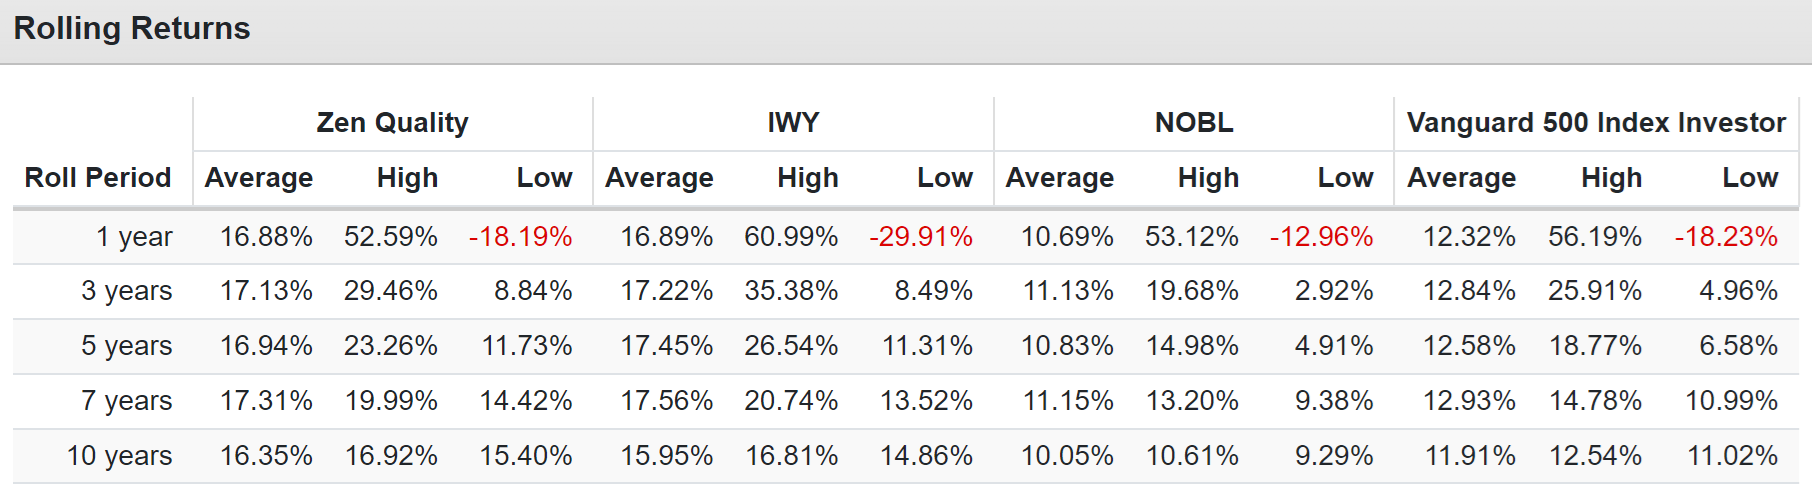
Portfolio Visualizer Premium
Keeping up with the best growth stocks but with less volatility. And look at the superior income growth.
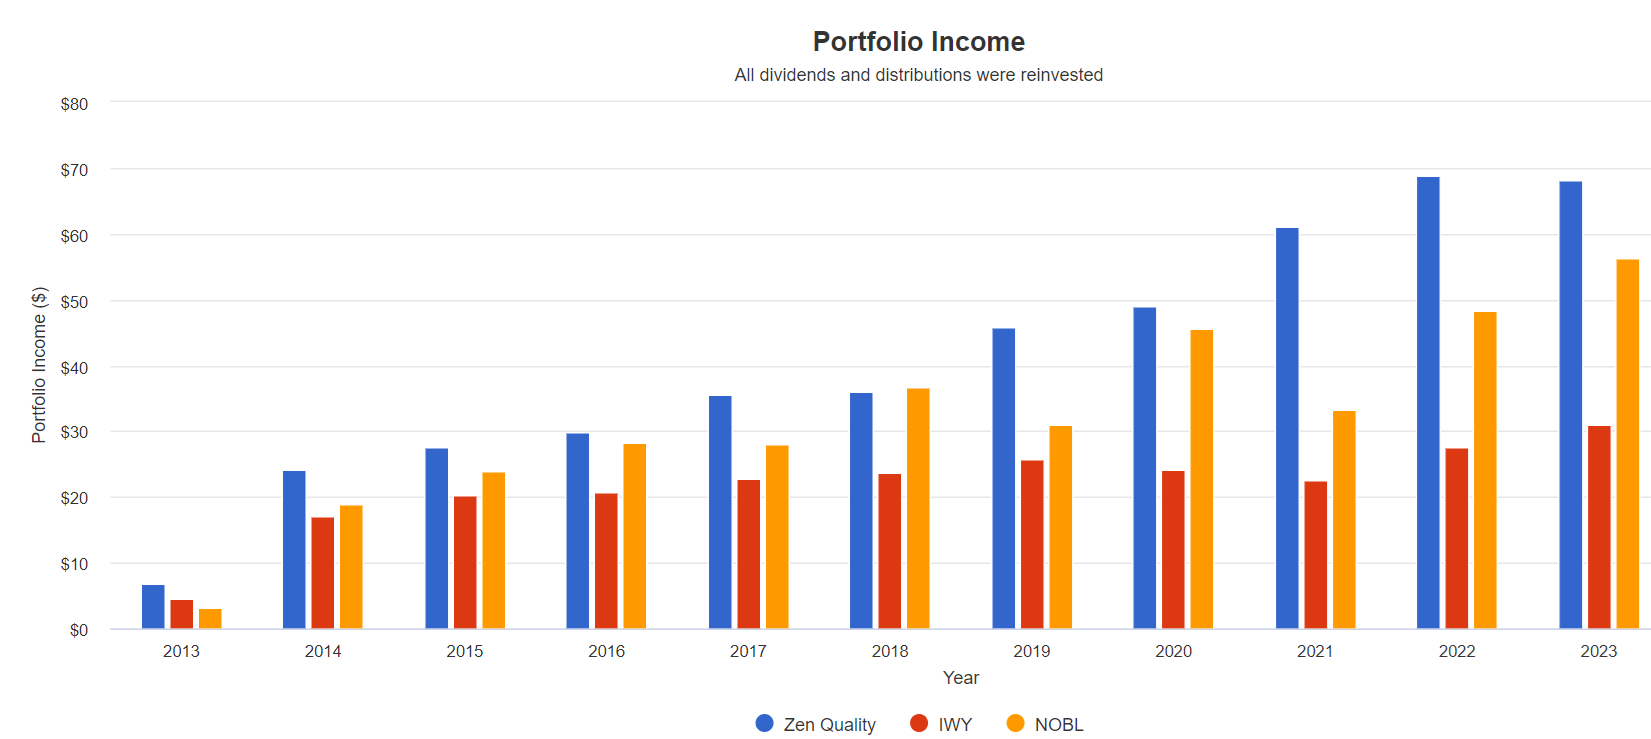
Portfolio Visualizer Premium
Let's see how income growth compares to IWY or NOBL.
The dividend aristocrats delivered 13% dividend growth for the last decade; however, they are expected to deliver just 9% to 10% in the future.
Zen Quality delivered 12% annual income growth, and Morningstar and FactSet expect 10% to 15% long-term income growth.
And speaking of the future, you don't have to wait ten or even five years to earn potentially attractive total returns.
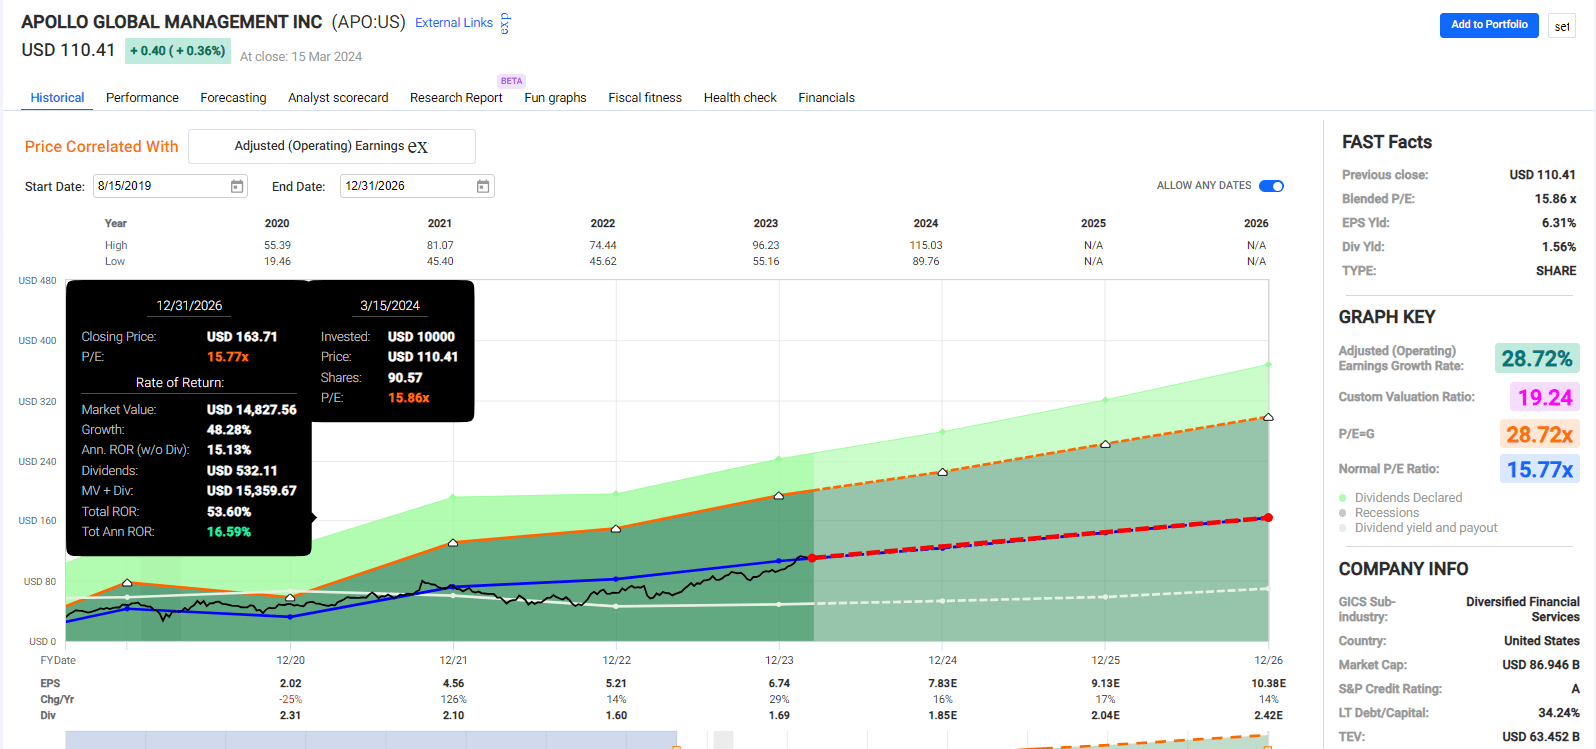
FAST Graphs, FactSet
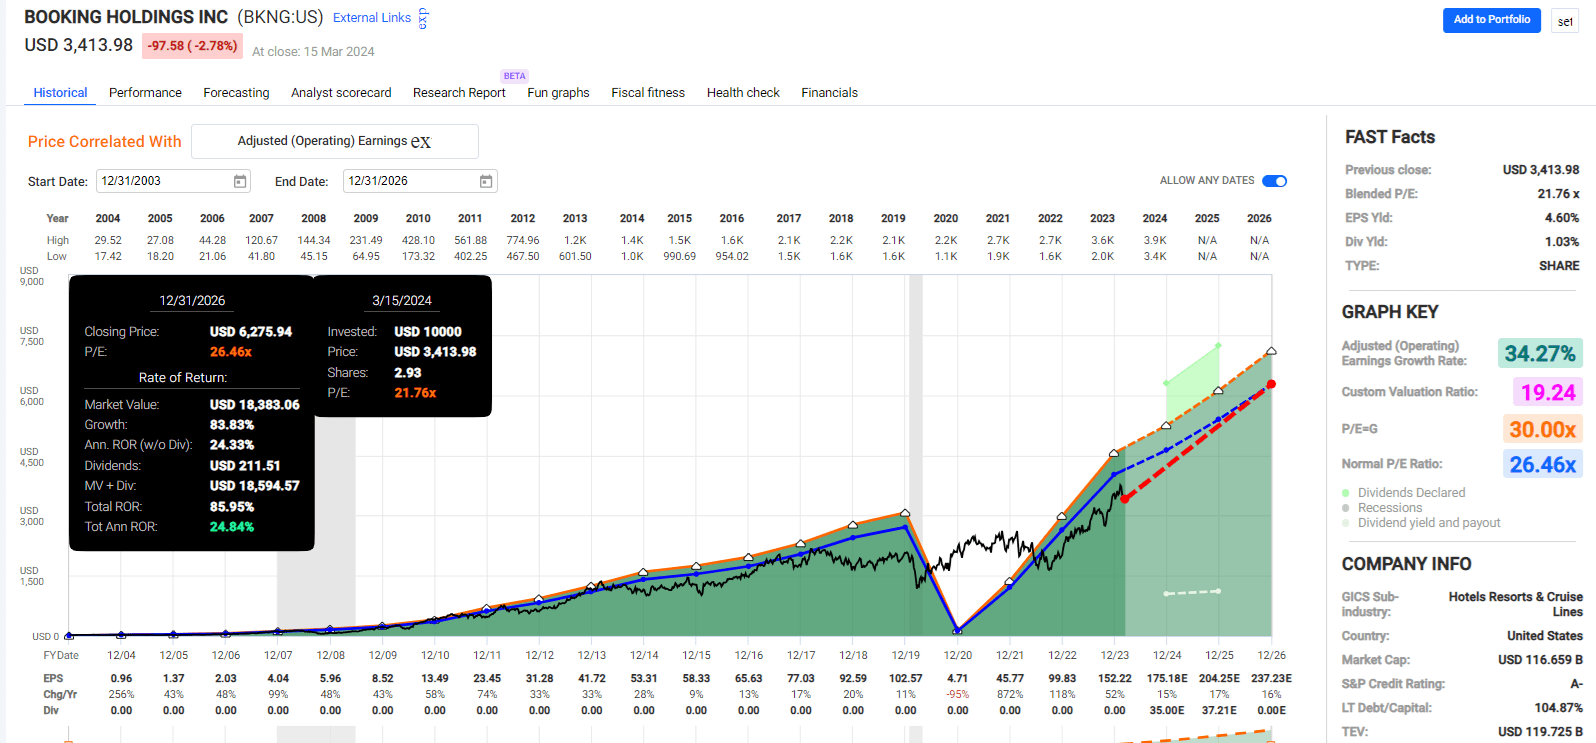
FAST Graphs, FactSet
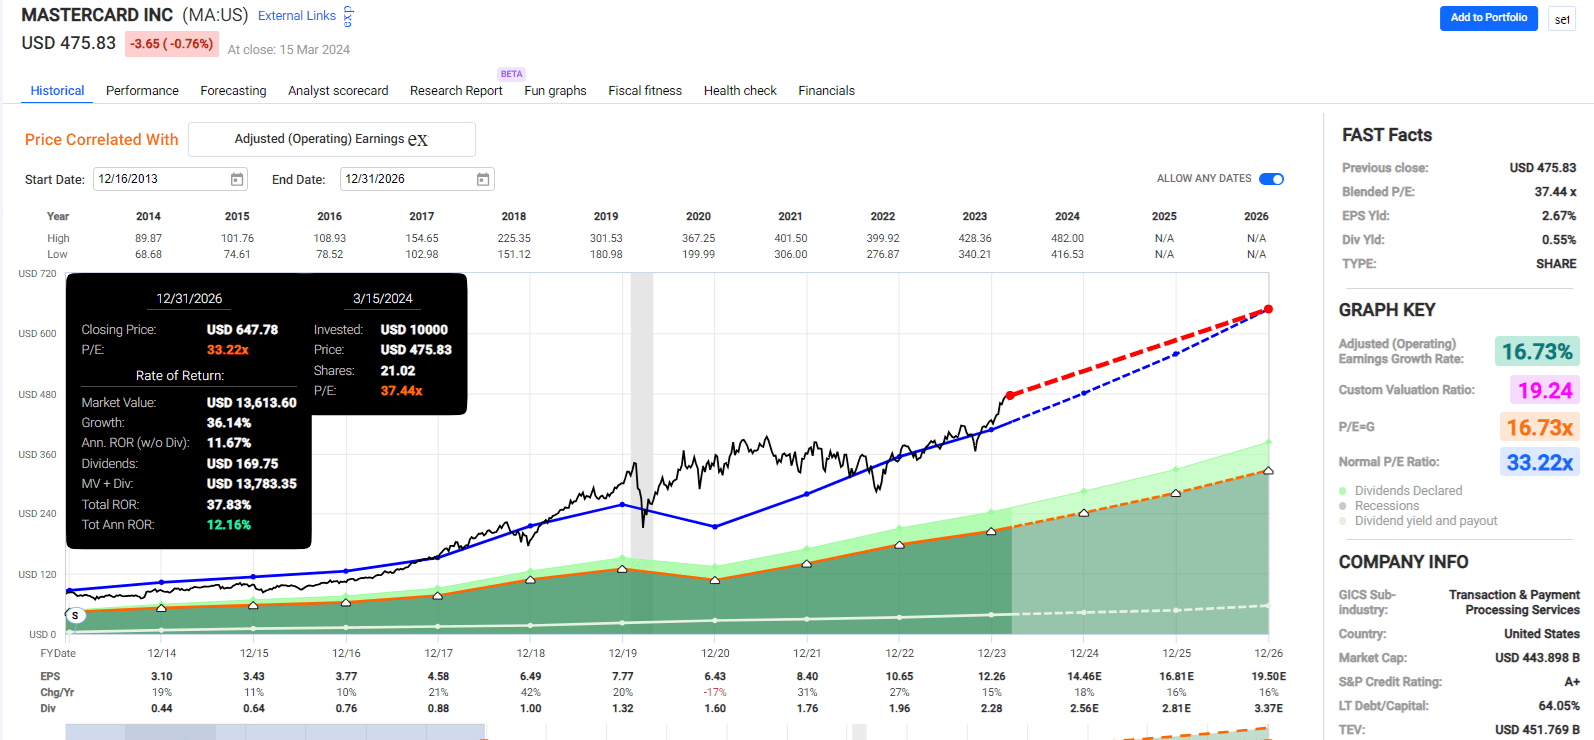
FAST Graphs, FactSet
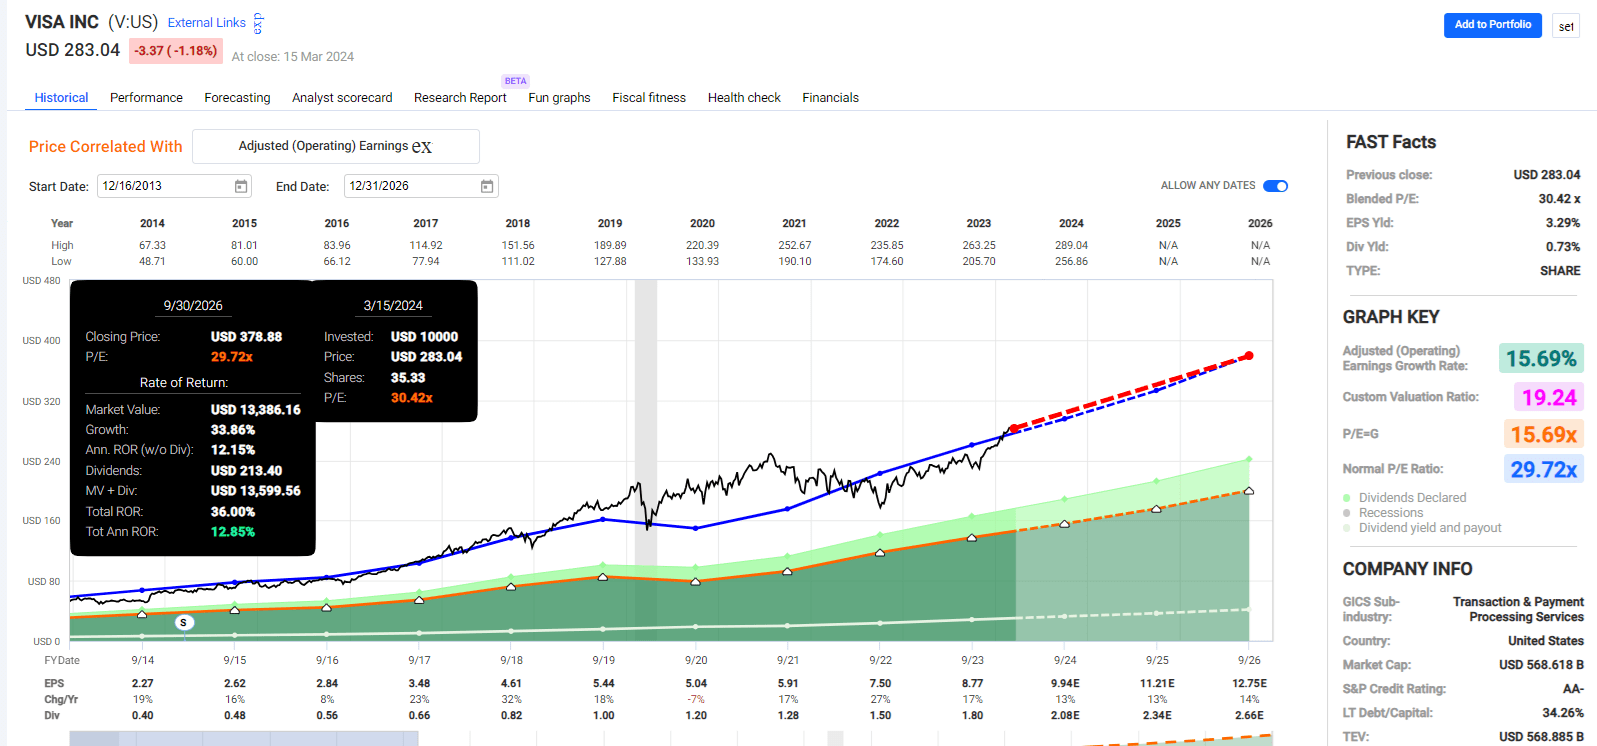
FAST Graphs, FactSet
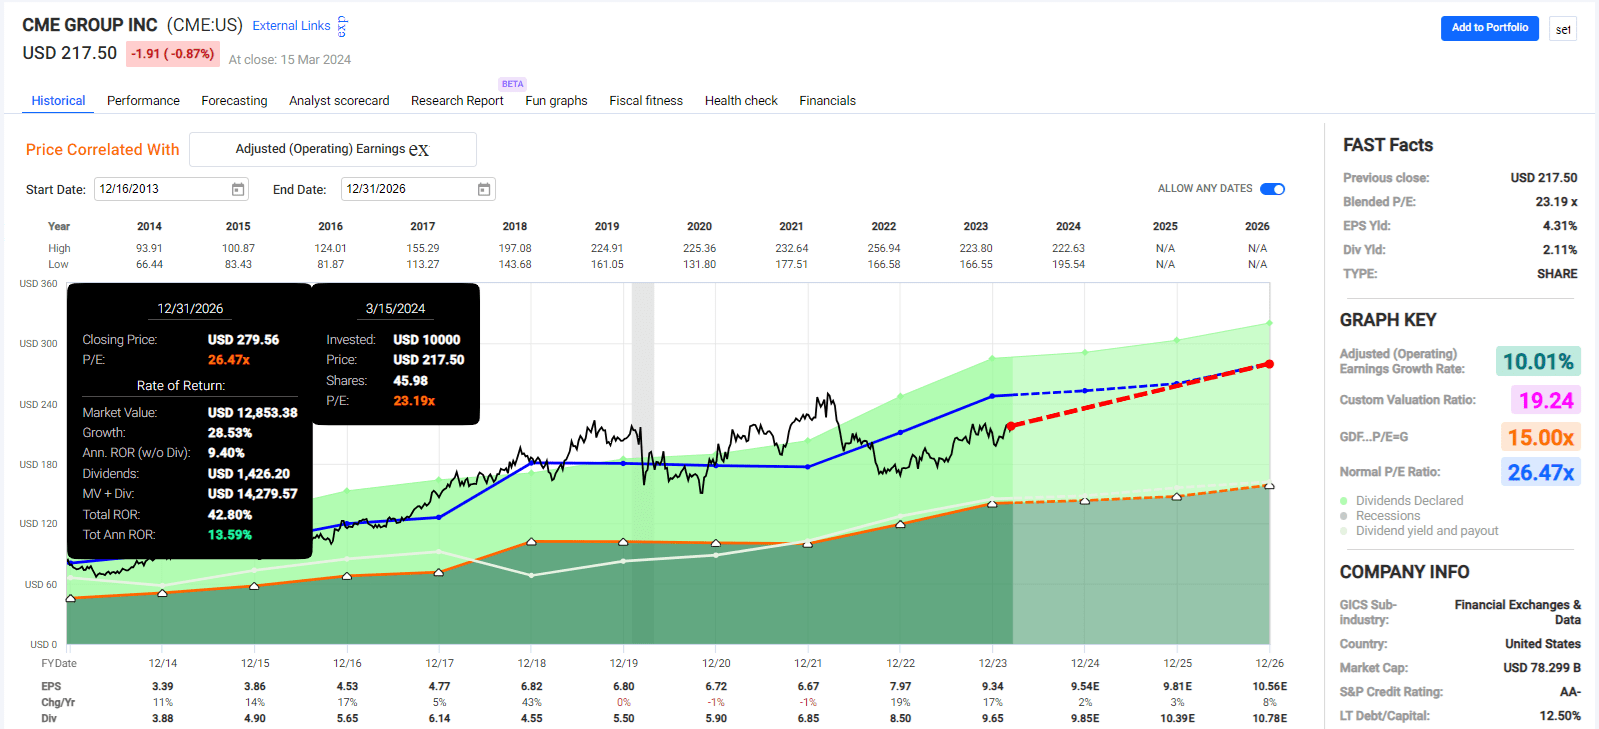
FAST Graphs, FactSet
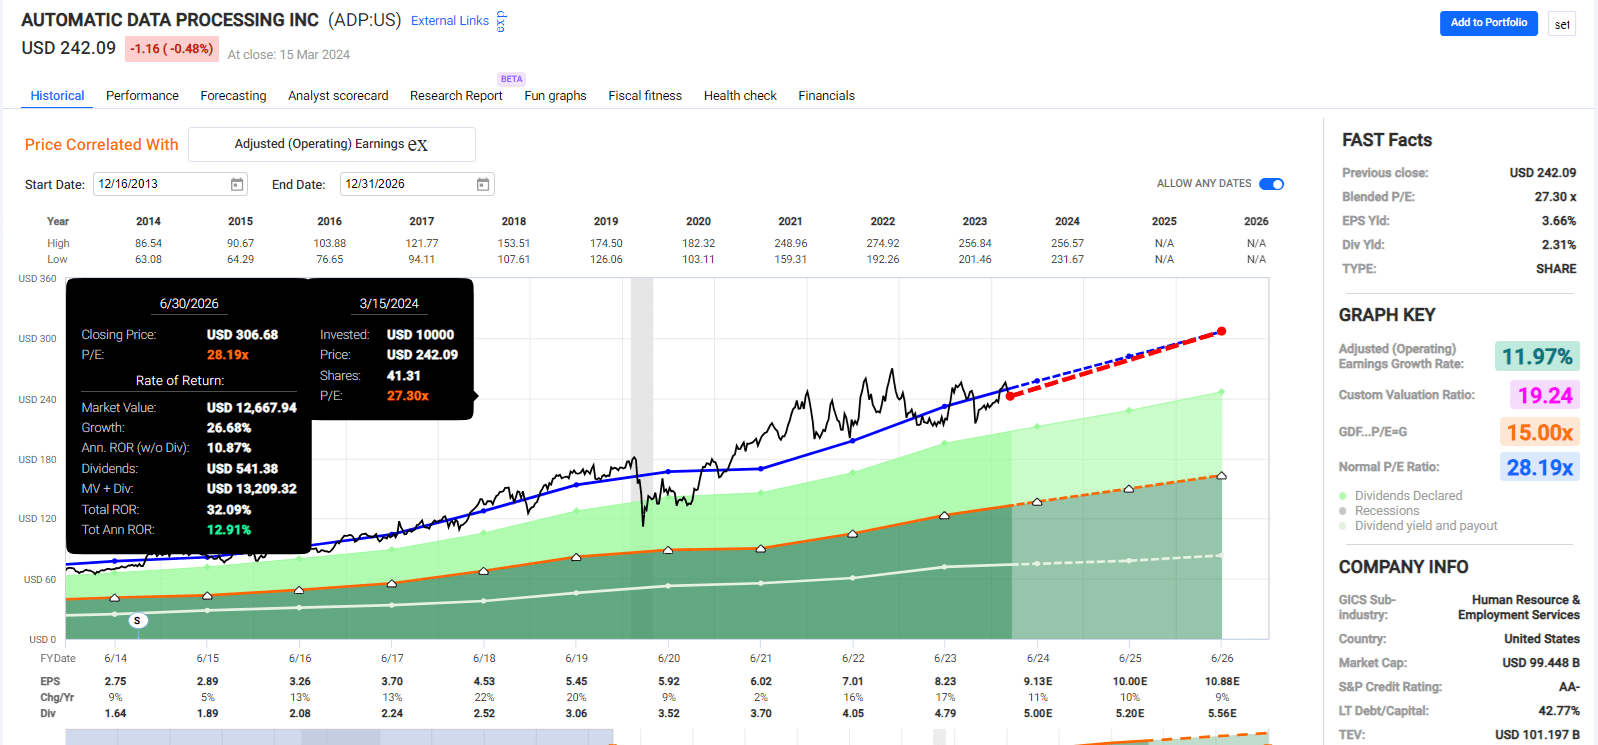
FAST Graphs, FactSet
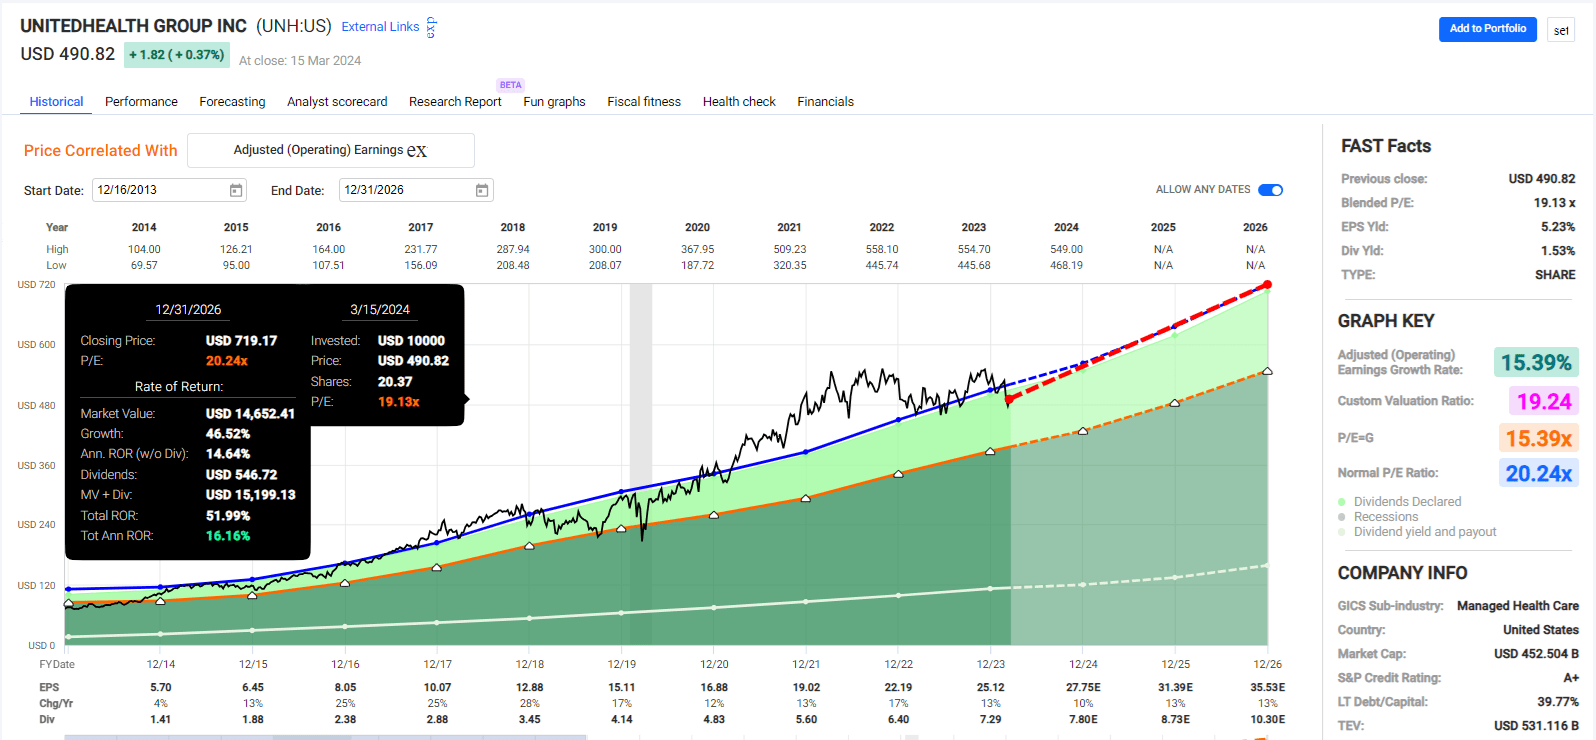
FAST Graphs, FactSet
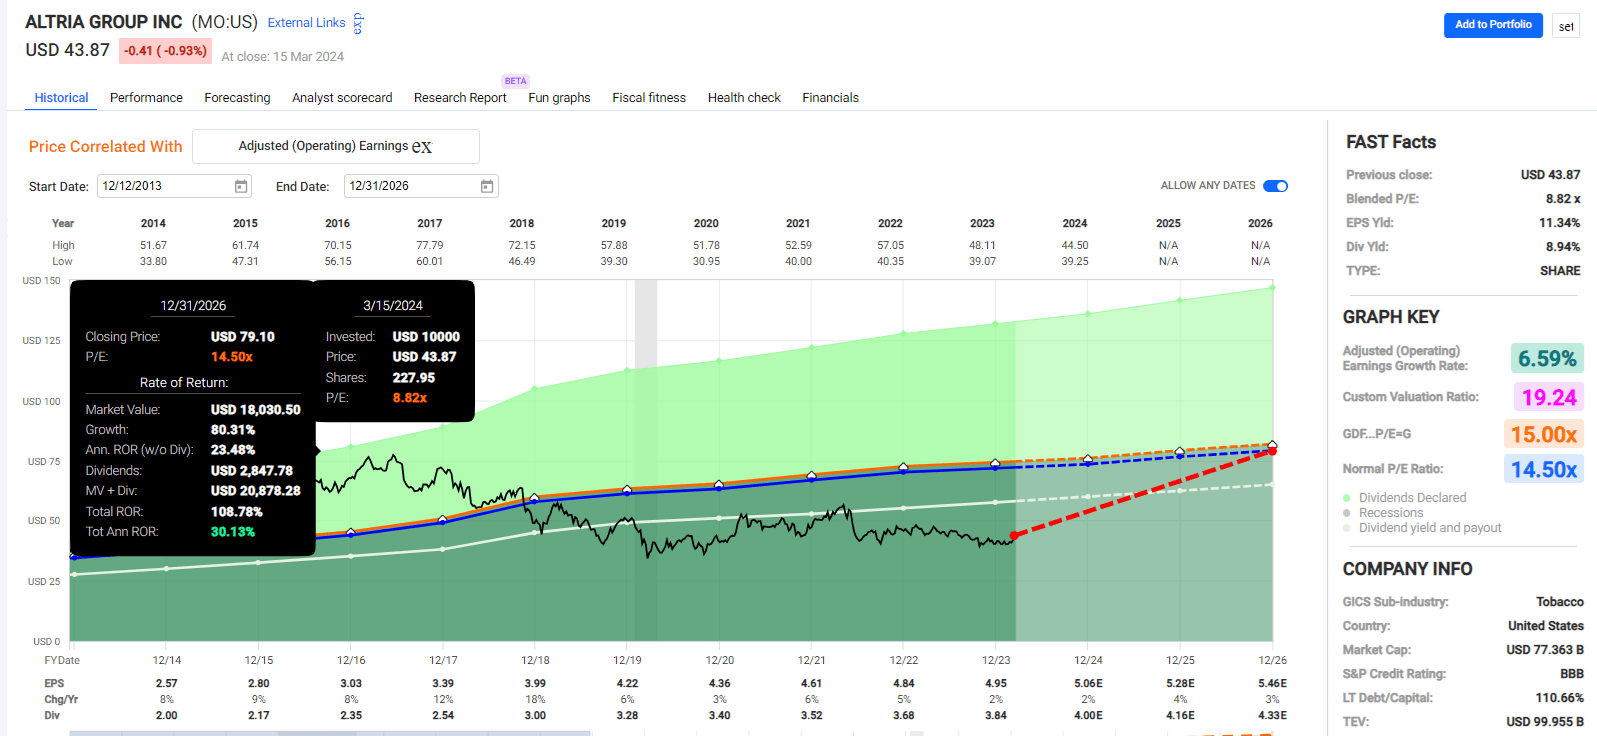
FAST Graphs, FactSet
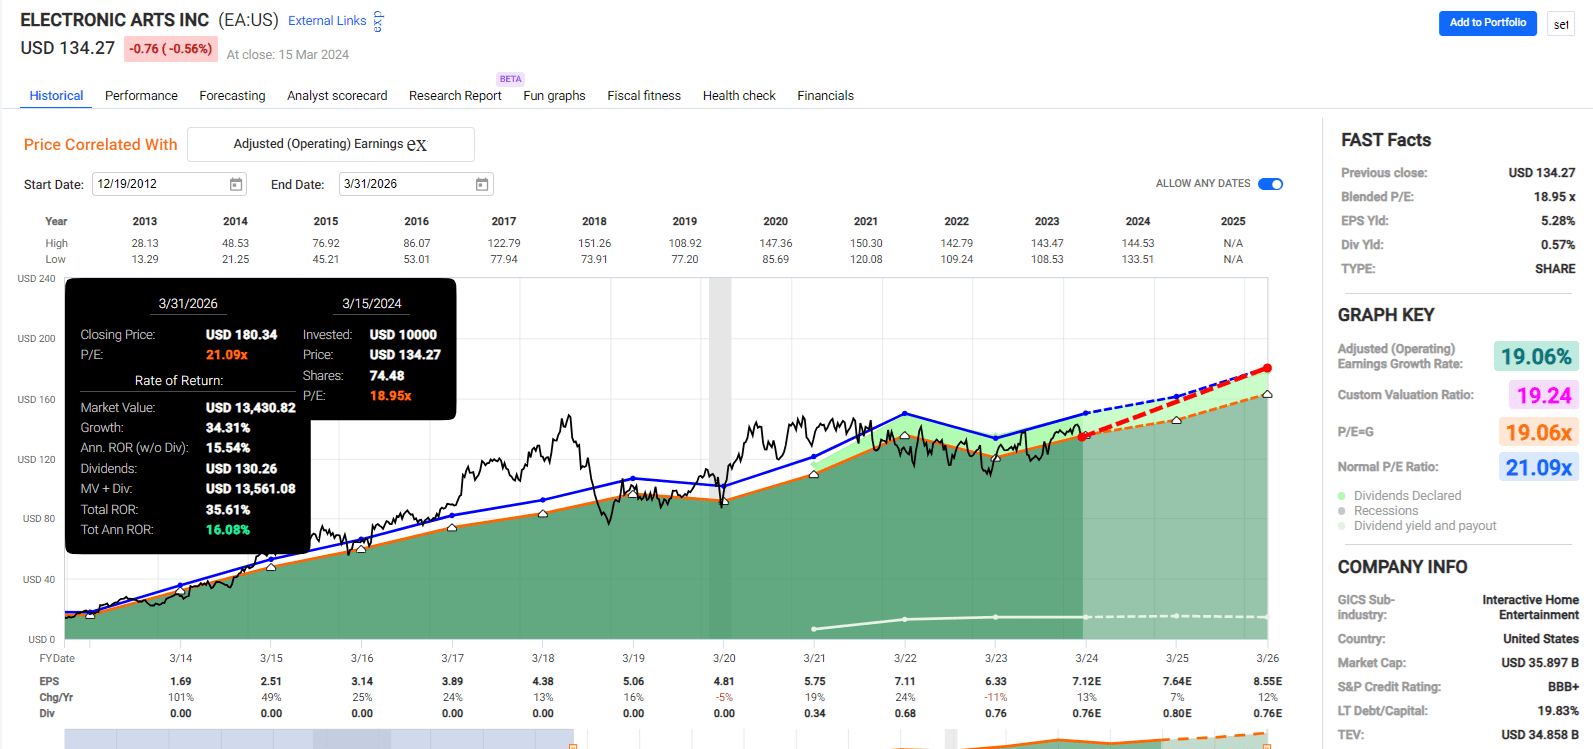
FAST Graphs, FactSet
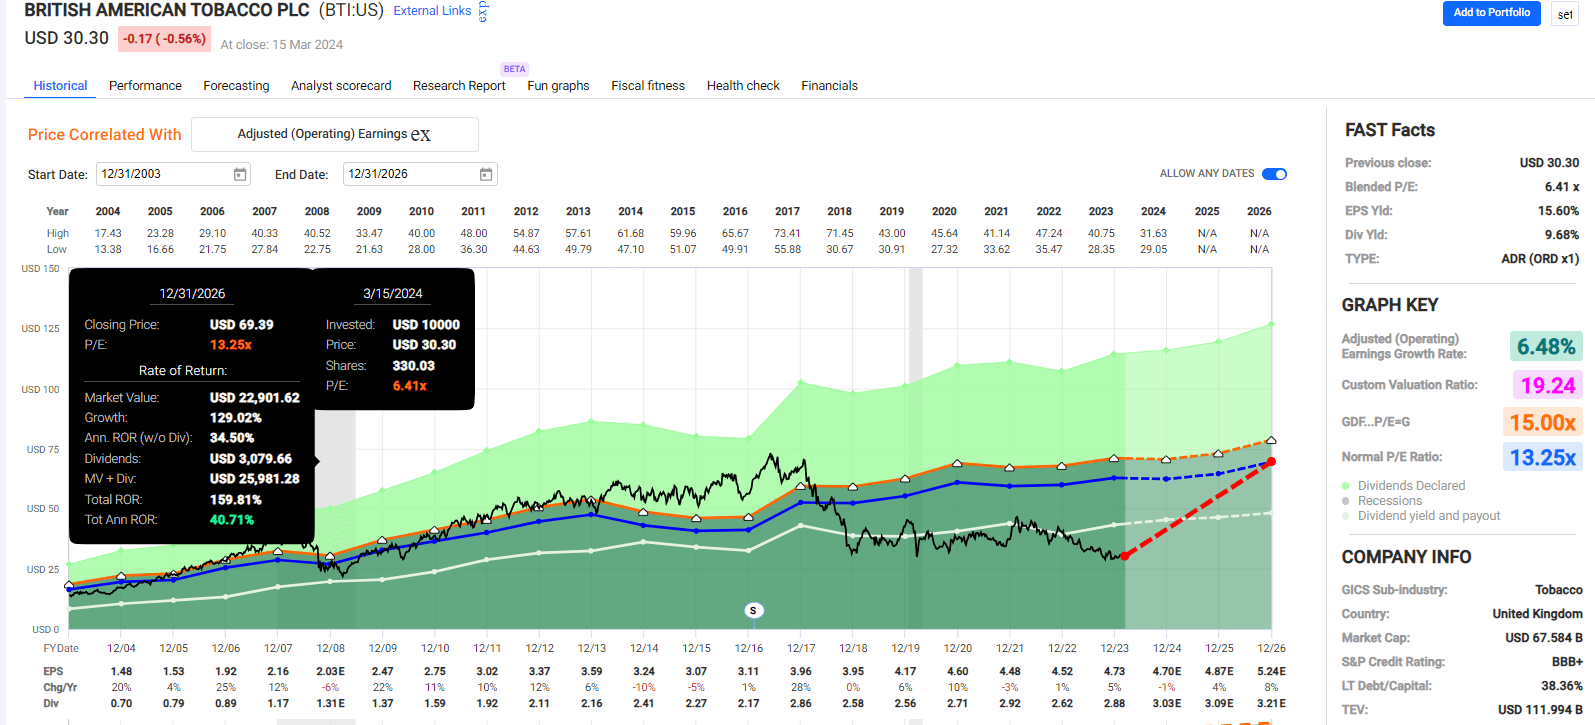
FAST Graphs, FactSet
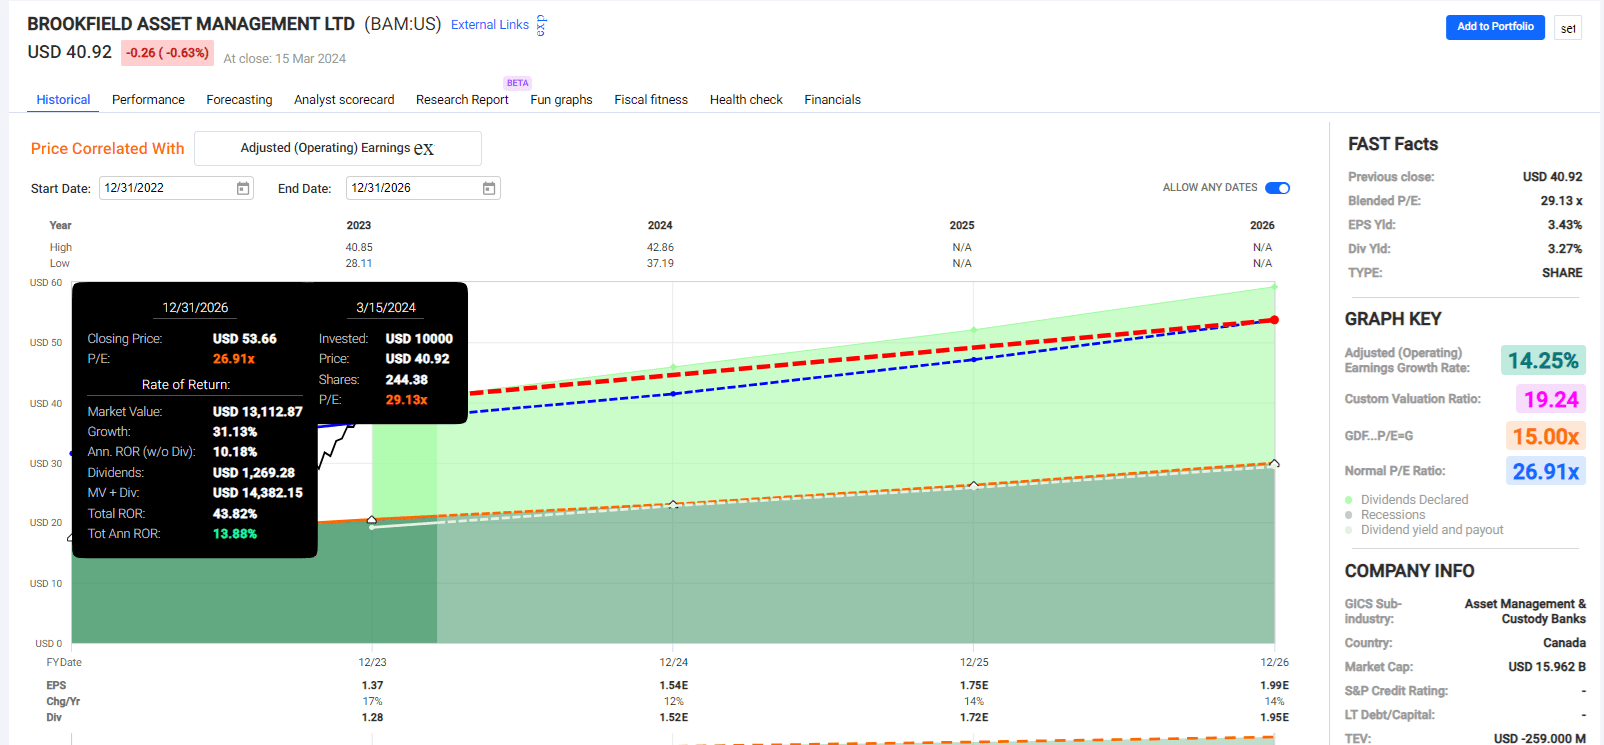
FAST Graphs, FactSet
Quality has nothing to do with volatility.
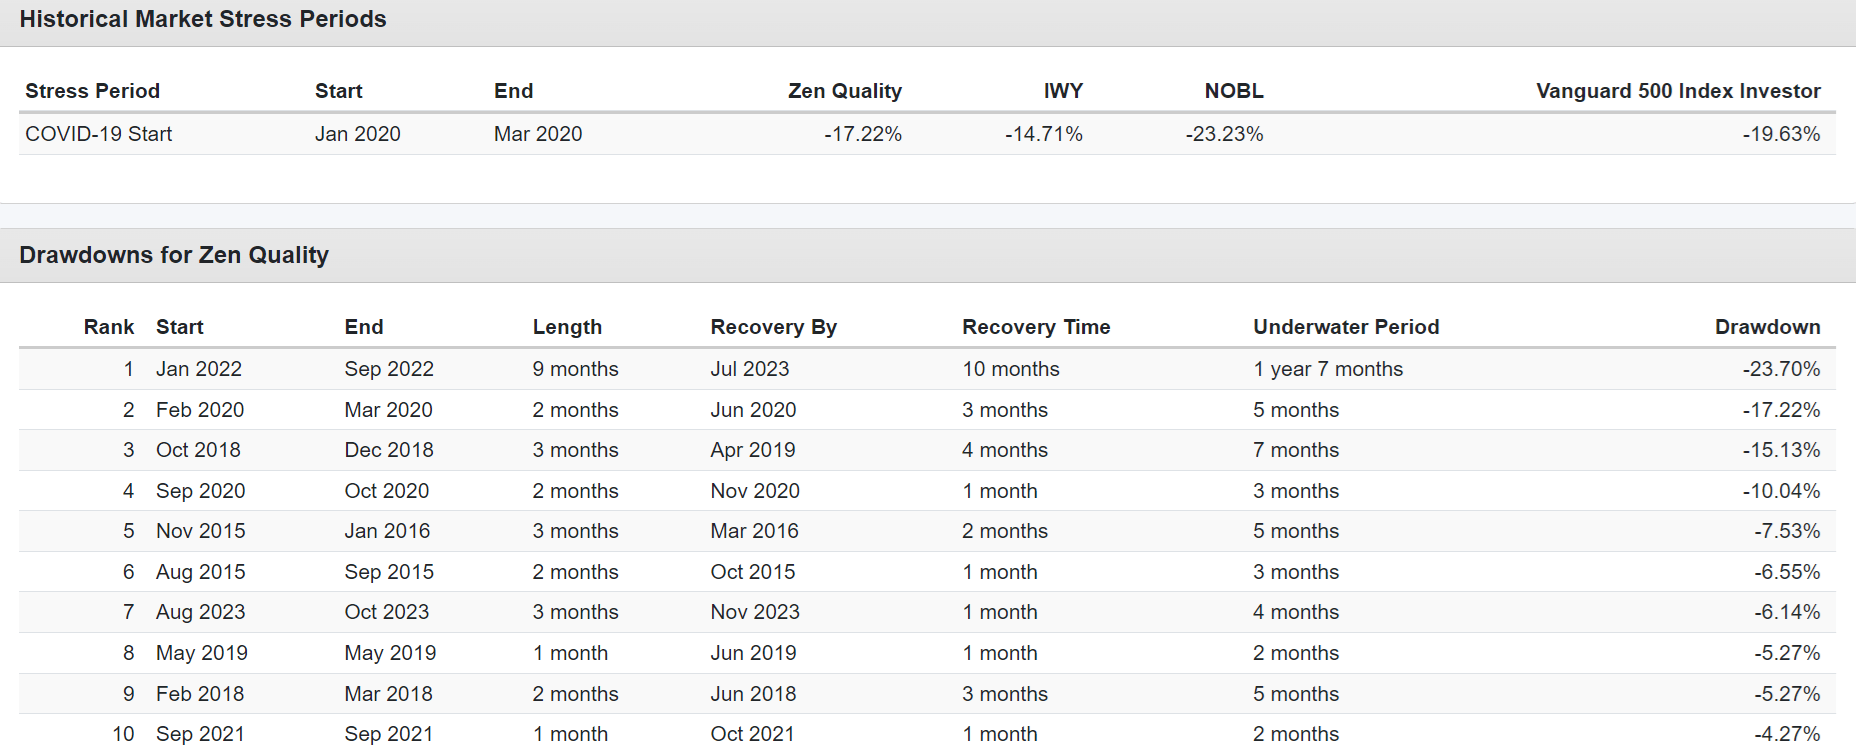
Portfolio Visualizer Premium
These declines during periods of extreme market stress, like the Pandemic, show that Zen Quality was less volatile than the broader market and the aristocrats.
And there has been just one bear market in the last decade. However, those relative volatility stats hide this portfolio's far more dramatic nature.
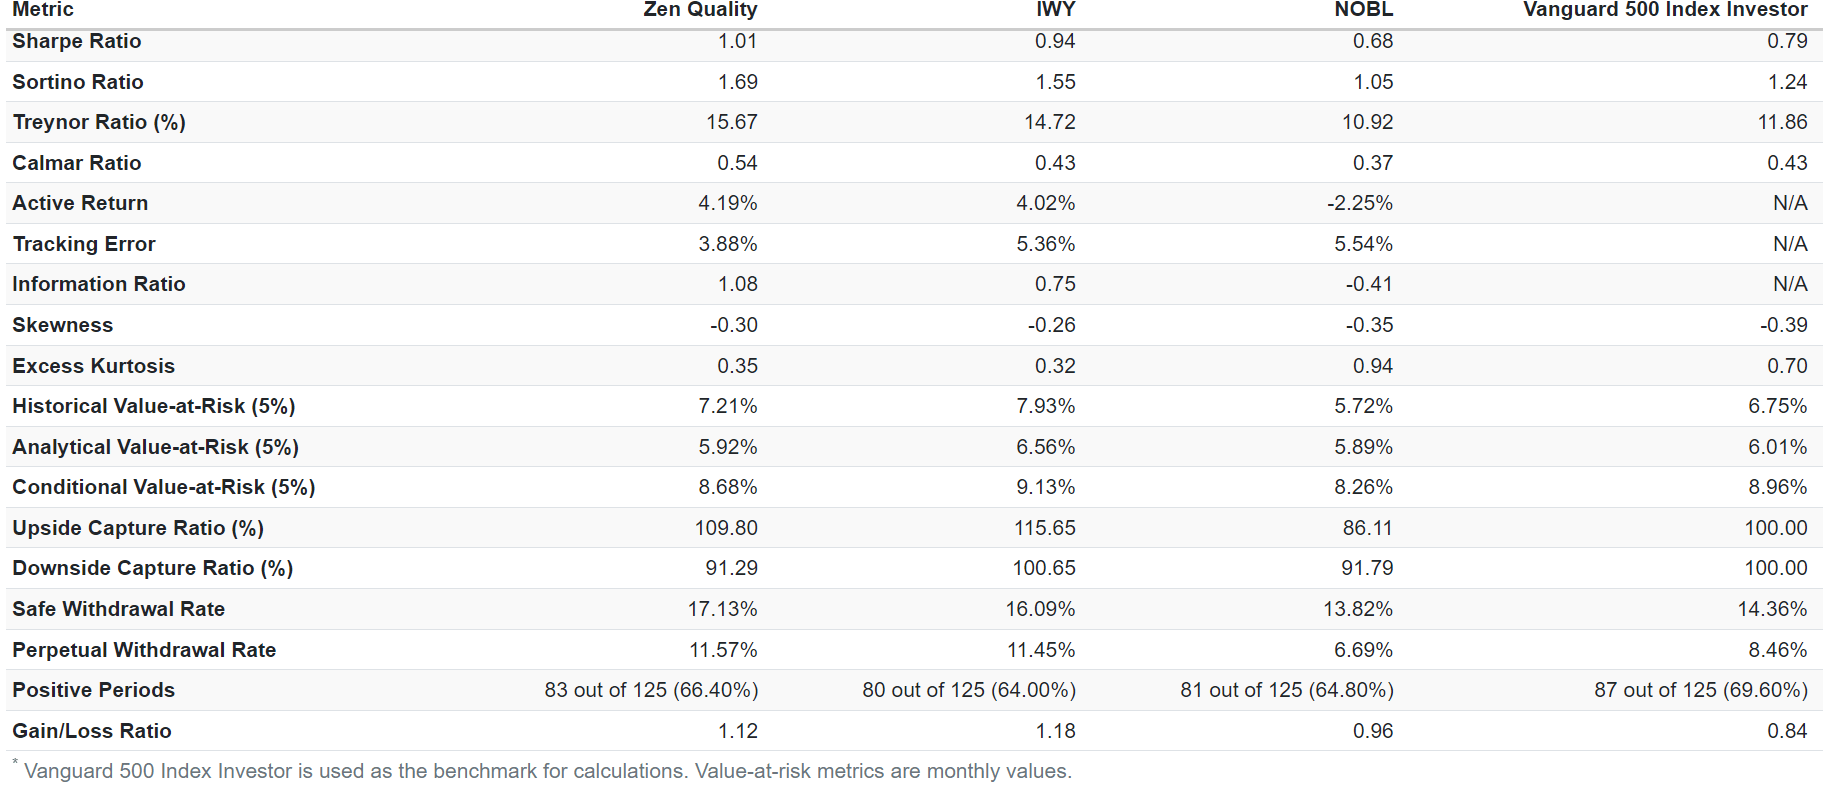
Portfolio Visualizer Premium
Conditional value at risk 5% is an advanced statistical model that considers realistic worst-case (average of the worst 5% of results) monthly returns.
Note how, for all of these portfolios, 8% to 10% monthly losses are normal. At some point, if you own the S&P, you must expect a 9% monthly decline.
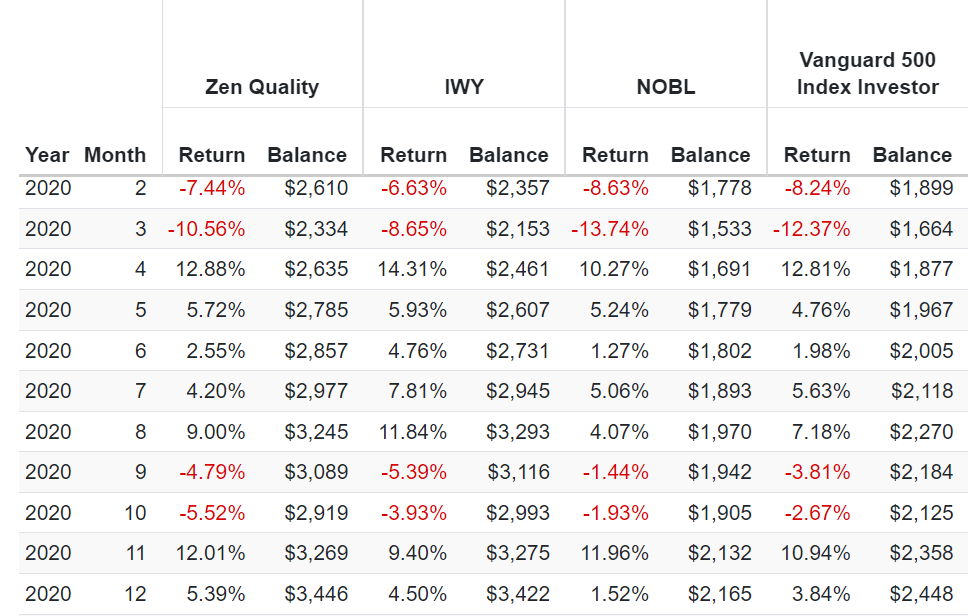
Portfolio Visualizer Premium
In 2020, we saw extreme swings, such as an 11% decline in one month and a 12% rally in November 2020 (vaccine announcement).
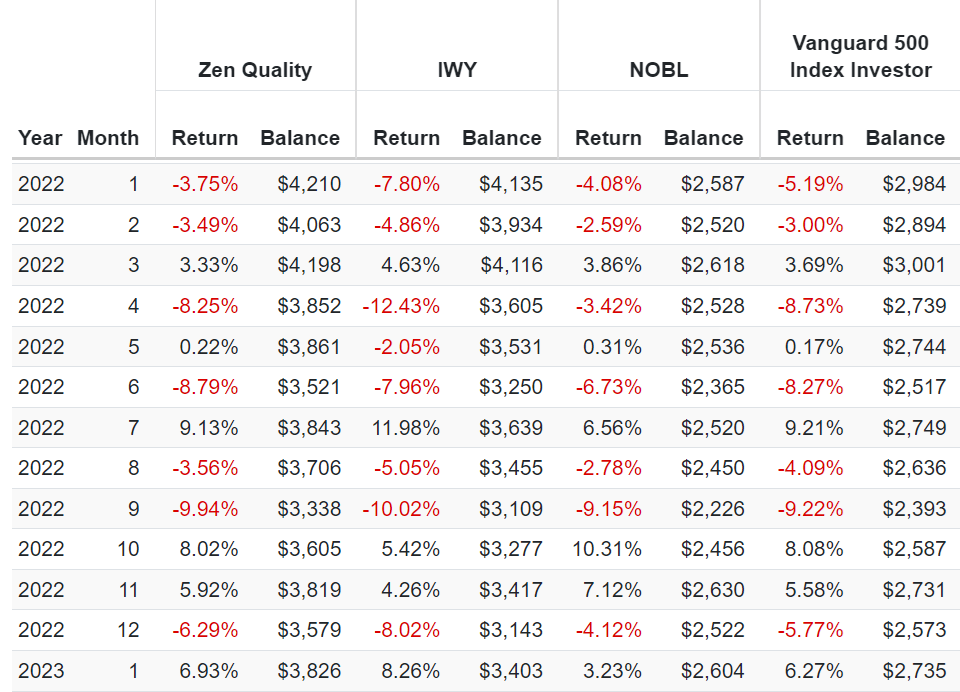
Portfolio Visualizer Premium
In 2022, during the Great Inflation bear market losses as high as 10% in one month, followed by strong rallies of 15% within weeks.
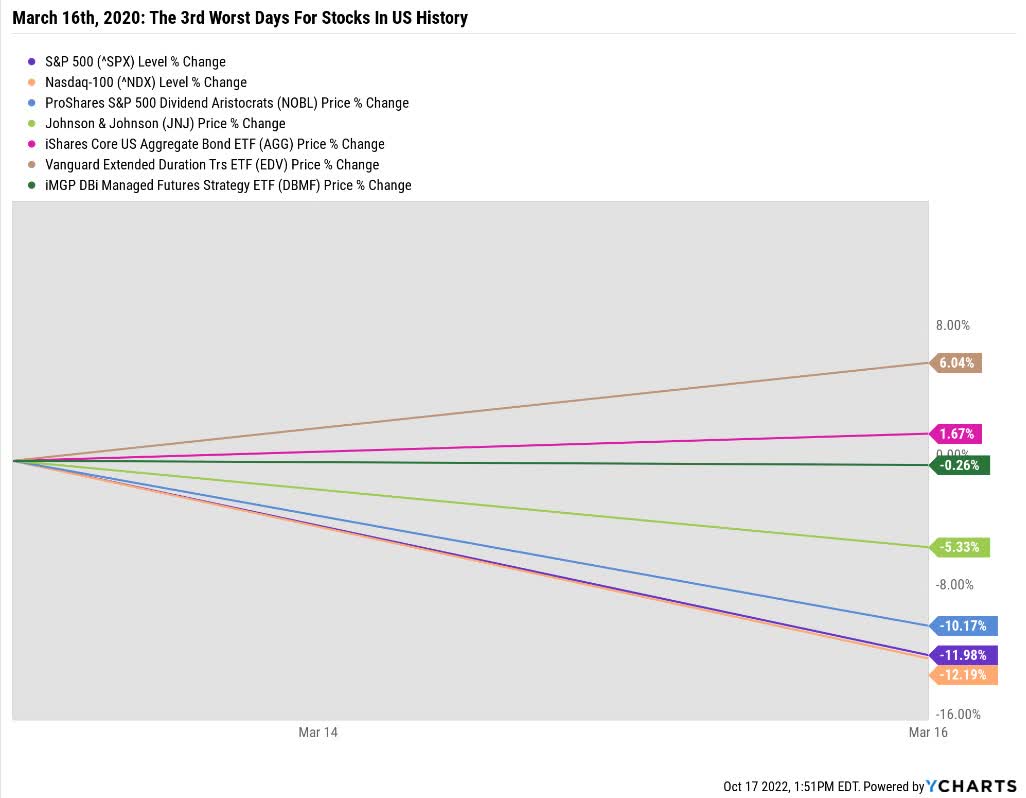
Quality tells you a company's profitability, and using other screens, dividend dependability, long-term risk profile, etc.
But even AAA-rated Johnson & Johnson (JNJ), a dividend king, fell 5% on March 16, 2020.
YCharts
How many investors would question that AAA-rated dividend king JNJ is a wide-moat Ultra SWAN? And yet it fell 5% in a day.
Let this be the ultimate example of why stocks are a "risk asset." Even one of the world's highest-quality and safest companies fell 5% in one day. If you live long enough, it will fall 5% or more on another day sometime in the future.
If anyone tells you that any stock is a bond alternative, they don't know what bonds are for. Bonds are insurance in the bad times, like when the market falls 12% in a day. In a flight to safety, US Treasuries tend to go up.
No stock, no matter how high quality, should ever be assumed to go up in a bear market.
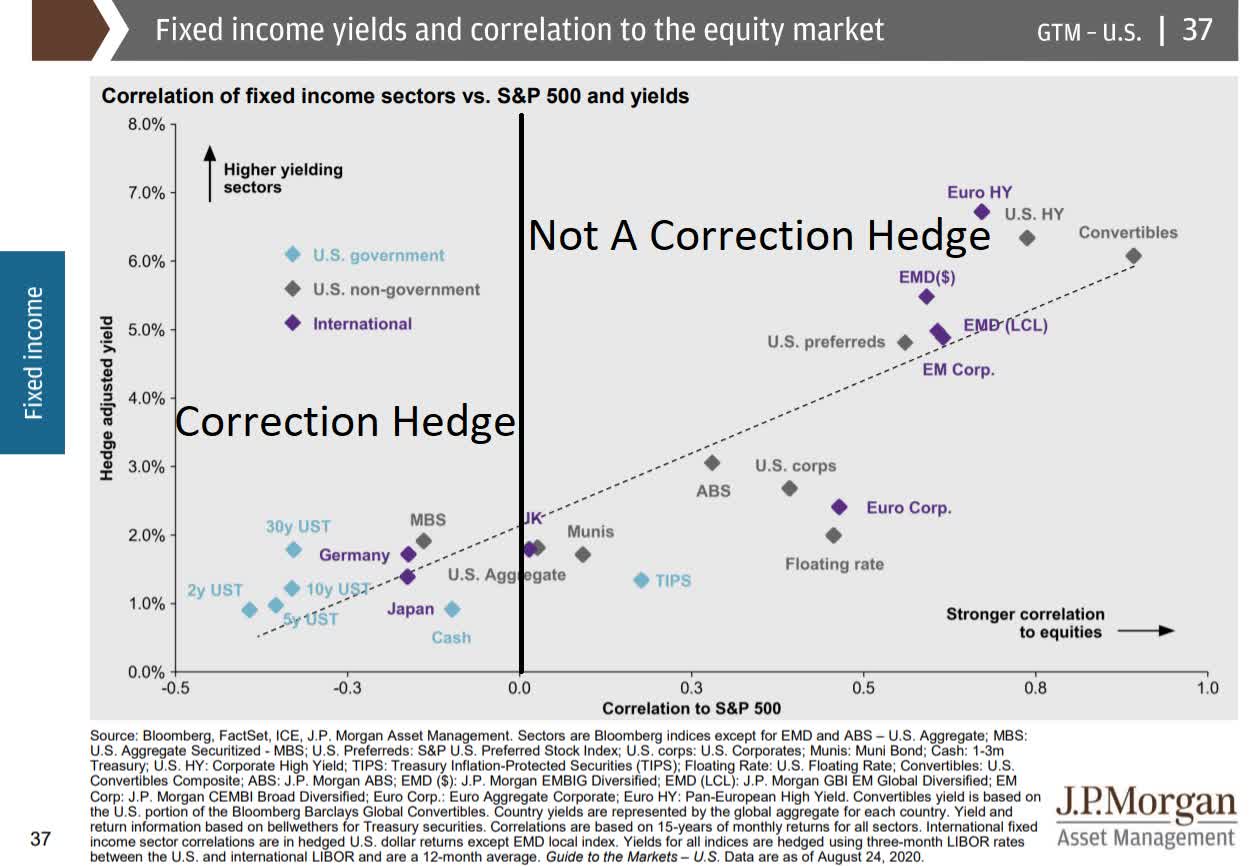
JPAM
Someone who owns pure stocks has to be willing to tolerate gut-wrenching volatility at times.
As long as they can do that, being pure stocks is OK. If they can't tolerate such volatility being 100% in stocks, no matter the quality is not prudent risk management.
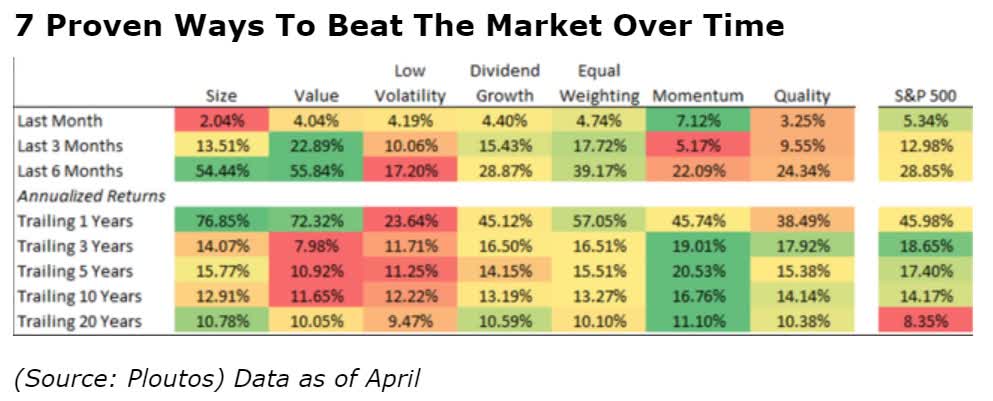
Ploutos
Quality is one of the proven Alpha factors. There are ways to beat the market over the long term.
Probability Of Each Factor Underperforming For This Length Of Time
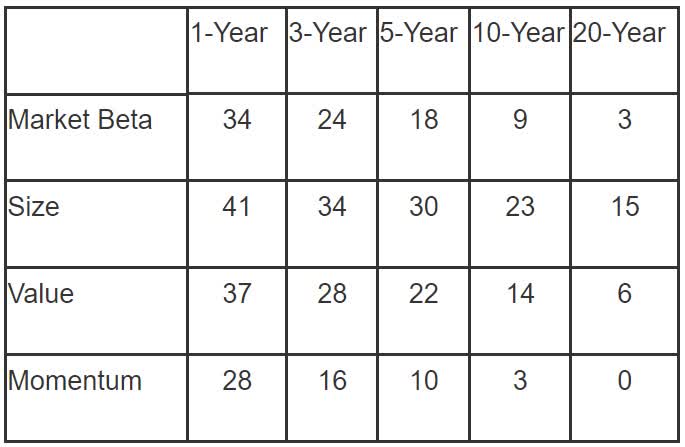
Fama & French
This is why multi-factor investing is usually the best approach.
If you're 100% value, then get ready for the occasional lost two decades. One in 14 20-year periods sees value underperform for that long.
Even the most successful recent factor, momentum, can underperform for ten or even years at a stretch.
Just as its prudent to diversify by sector, diversifying by factor is prudent.
What about the 11 high ROC/PEG companies outlined here?
Every factor other than size and low volatility.
With the right tools, you can tailor your search to find the best opportunities for any factor, goal, risk profile, or even different time frames.
In today's overvalued market, you might assume nothing is on sale. But something great is always on sale if you know where and how to look.
Quality, value, yield, growth, even low volatility, whatever your needs, blue-chip bargains are always raining from the sky, like Christmas in July.